While people have been using wind power for thousands of years, only in the last century has it been used to generate electricity, and only recently has utility-scale electricity generation become economically feasible. In the early 1900's, Denmark became the first country to generate wind powered electricity (Golob and Brus 1993). For many decades thereafter, wind power was not considered a viable energy source in comparison to widely available and inexpensive fossil fuels. The oil shortages of the 1970's changed the perception that fossil fuels could meet all of society's energy needs. This led to a renewed interest in alternative energy options, including wind power. Since that time, great gains have been made in the efficiency and reliability of wind turbines.
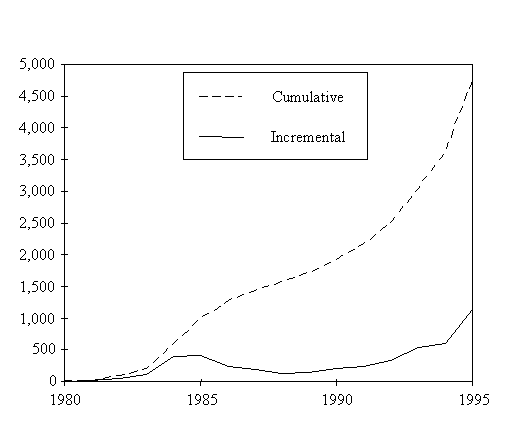
Although wind currently accounts for less than one percent of electricity production worldwide, installed wind capacity is rapidly growing. Between 1980 and 1995, world wind capacity increased from 10 megawatts (MW) to nearly 5 gigawatts (GW) (see Figure 1). This increase was largely fueled by the declining cost of wind power and increasing concern about pollution. By 1995, 12 countries possessed more than 20 megawatts of installed wind power capacity (see Table 1), with Europe holding just over 50% of the total. According to Grubb and Meyer (1993), wind could meet 20% or more of the world's electricity demand within the next forty to fifty years.
| Country |
|
||
| United States |
1770
|
||
| Germany |
1137
|
||
| Denmark |
630
|
||
| India |
550
|
||
| Netherlands |
250
|
||
| United Kingdom |
193
|
||
| Spain |
126
|
||
| Sweden |
67
|
||
| China |
36
|
||
| Greece |
28
|
||
| Italy |
23
|
||
| Canada |
21
|
||
| Rest of the world |
69
|
||
| Total Installed Wind Capacity |
4900
|
||
Recently, a large market for wind energy has developed in Asia, particularly in India and China. In 1995, Asia installed 340 megawatts of new capacity, representing an increase of 160% in one year (Anonymous 1996). The large number of wind energy assessments that have been conducted recently for countries near the Mediterranean and Red Seas suggests growing interest in this region as well (Radwan 1987; Habali et al. 1987; NREA 1989; Pallabazzer and Gabow 1991; Katsoulis and Metaxas 1992; Katsoulis 1993; Haralambopoulos 1995; Incecik and Erdogmus 1995; Pashardes and Christofides 1995; Tolun et al. 1995; Turksoy 1995).
One factor that inhibits the widespread use of wind power is the difficulty encountered in selecting sites. Since the 1970's, the United States and Denmark have made significant progress in wind selection techniques, but as yet there is no universal model. Because wind potential assessments are site specific, they tend to be very time consuming. This often means that wind energy developments require a large initial investment for careful wind prospecting studies. This makes wind power unattractive for most developing countries, whose economic situations force them to find the most inexpensive and expedient means of energy production available.
The main goal of this thesis is to aid Eritrea in surmounting some of these obstacles to wind energy development through a detailed, albeit preliminary, evaluation and analysis of Eritrean wind data. In the following sections, wind power characteristics, technology, and economics are discussed. This chapter concludes with a general description of wind assessment methods before moving on to the country-specific component of this study in Chapter 4.
Power in the wind is extracted by wind turbines, which have rotor blades shaped like the wings of an airplane. When wind blows over these blades, it moves faster over the curved side of the blade than it does over the flat side, causing the air pressure to be higher on the flat side of the blade. This pressure differential causes a force that turns the rotor. This rotational energy is then converted to electricity by the generator.
Wind turbines may be categorized into four sizes as follows:
For Eritrea, machines between 100 and 300 kilowatts, with simpler technologies and longer field experience seem most appropriate. These smaller machines are easier to transport and install and may also require less maintenance. Furthermore, they can offer reliability through incorporation of a larger number of machines, thereby reducing output variability when one of the machines is not operating.
Turbines with electrical capacities over 500 kilowatts (kW) are likely to be unsuitable for a number of reasons. Transportation and installation requirements are more demanding and costly, requiring larger cranes, larger and better highways, and greater technical expertise.
The materials and technologies required for wind development differ considerably from those used in traditional energy sources. In determining the suitability of the large-scale utilization of wind energy for a given region, costs and benefits of the technology must be carefully weighed. This section discusses the issues that must be taken into account when considering wind power development.
Although good wind resources are essentially inexhaustible and are much more widely distributed over the earth's surface than traditional fuels, a major liability is that the wind itself cannot be stored or shipped. However, once wind power has been converted to electricity by turbines, the electricity may be used immediately or stored. The issues of wind power integration and storage are discussed below.
Integration. If wind-generated electricity will be used immediately, the intermittence of the wind resource becomes an issue. Air does not move at a continuous speed, even at the best wind sites. Wind speeds may fluctuate considerably on hourly, daily and even yearly bases. Although the availability of wind power sometimes parallels demand, the correlation is unlikely to be perfect. Because of this, wind cannot generate 100% of electricity demand without substantial storage capacity.
Due to the intermittence of the wind resource, a high percentage of wind capacity connected to an electricity grid decreases system reliability. Large-scale power systems with low wind penetration create fewer wind integration problems than do those with higher penetration. In most systems without storage, wind can contribute between 25 and 45 percent of the total electricity before operational losses become prohibitive (Grubb and Meyer 1993). If the installed wind capacity is larger than this, the wind power output can be smoothed by erecting many wind turbines in a variety of wind regimes.
Another way to increase system reliability is to install additional power sources, either as backup systems or to work in conjunction with the wind system. Hydropower generators and gas turbines provide the best consistency because they can be quickly turned on and off in response to wind power fluctuations. Diesel generators can also be used when wind velocity is low and stored electricity is not available, but their response times are not as short as those of hydropower and gas turbines.
Storage
Since wind power is an intermittent energy source, some method of storing energy is necessary for high wind penetration systems to ensure adequate supply during periods of peak consumption. Some candidate storage technologies include batteries, pumped hydro, and hydrogen fuels. For smaller applications, battery storage can be cost-effective. This is especially true for hybrid systems that include a diesel engine, where the cost of diesel fuel is very high. A cost-effective technology that can be used for large wind power applications is pumped hydro, which uses excess energy during times of low demand to pump water from a low reservoir to a high reservoir. This water is then released through a turbine to generate electricity when it is needed. Chemical energy storage in the form of hydrogen fuels may be a promising application for coastal wind plants in the future.
Production, Installation and Maintenance
One of the main benefits of wind power is the small size of wind turbines compared to conventional power plants. This allows the manufacture, transportation and installation of wind turbines to be achieved in a shorter period of time and with fewer requirements for heavy machinery. This characteristic of wind systems also makes them extremely modular, and therefore, scaleable. Wind power can be produced with one, ten, hundreds or even thousands of machines. Increasing or decreasing capacity as needed does not require the outlay of huge capital expenditures at any one time. In addition, wind systems can continue generating electricity even when one or more machines are down for maintenance. Although new combined-cycle gas generation offers similar modularity benefits, conventional large-scale power plants require years of planning and building, and must be built on-site. In addition, they cannot produce power during periods of maintenance or repair.
Compared to most other methods of power generation, wind power generation is environmentally benign. Common negative aspects of conventional power production, such as air pollution and water consumption, are negligible in wind power production. Following are some environmental and aesthetic impacts that are commonly associated with wind power systems.
Land requirements. For utility-scale wind applications, a large number of turbines must be installed to intercept a large amount of wind power. To minimize interference with each turbine's wind resource, turbines in large wind farms are typically separated by 5 to 10 rotor diameters. Therefore, a medium-sized wind turbine requires about 10,000 square meters, or one hectare, of surrounding land.
Field studies in California indicate that wind projects occupy about 7.1 hectares per installed megawatt (Gipe 1991). Using this figure, a wind farm with the capacity of an average nuclear power plant (about 1 gigawatt) may require an area of over 70 square kilometers. These requirements may seem demanding at first glance, but actually compare favorably with land requirements for coal or nuclear generation when the full life-cycle requirements of mining, processing, transportation, and waste disposal are considered. In addition, since only about 10 percent of a wind farm area is actually occupied by the turbine base and access roads, the remainder can be used for farming or grazing, as is currently the practice in Europe and California, respectively.
Visual impact. Because wind turbines are typically between 20 and 50 meters in height, a significant visual impact of a large number of turbines in an open area is unavoidable; however, the effect of a wind farm's presence is subjective and opinions vary widely. Surveys have shown that uniformity of size and spacing improves aesthetic acceptability considerably (Clarke 1991). In addition, tolerance of other large structures such as pylons, utility towers and telephone poles suggests that negative opinions may be more a matter of habituation than of the appearance of the objects involved.
Noise
Noise created by gearboxes and blades can be a problem in populated
areas and may even limit settlement within audible range. This issue has
received considerable focus in densely populated areas, such as Europe.
For both noise and safety reasons, care should be taken to ensure a distance
of several hundred meters between the turbines and the nearest habitation.
Electromagnetic interference
To avoid problems of interference with vital radio transmission services
such as aircraft navigation systems, the locations of such facilities in
relation to the wind turbines should be carefully studied. Where potential
problems exist, careful choice of turbine design and materials can reduce
radio interference. Otherwise, a booster receiver/transmitter can be installed
at the facility.
Wildlife disturbance
Birds seem to be the only wildlife adversely affected by wind turbines.
The wind farm most often cited in relation to avian issues is Altamont
Pass in California, where bird strikes occur often enough to raise concerns
over the issue. A 1992 study commissioned by the California Energy Commission
(CEC) estimated that several hundred raptors are killed by turbine collisions,
wire strikes, and electrocutions at Altamont Pass each year. According
to the study, 39 of the birds killed in 1992 were golden eagles, a significant
figure given a total population of only 500 breeding pairs (Orloff and
Flannery 1992).
Bird kills can be limited by avoiding wind farm development in known bird migration routes, especially in locations of known rare and endangered bird species. At present, a joint effort between turbine manufacturers and scientists is underway to research rotor and tower modifications to reduce this danger (Predatory Bird Research Group 1995).
Political and Economic Issues
Wind energy offers many political and economic benefits, including:
The actual price per kilowatt of wind-generated electricity depends on many factors. Therefore, the following section has been dedicated to a more detailed discussion of the cost wind power.
The Cost of Wind Power
The California Energy Commission (1997) estimates that the cost of new wind power in the U.S. is about 4.6 cents per kilowatt-hour, compared to 4.6 to 6.0 cents per kilowatt-hour for coal technologies. Recently, new technologies have also lowered the cost of electricity generated with natural gas or gasified coal. Cost estimates for new combined-cycle natural gas generation are as low as 2.5 cents per kilowatt-hour (kWh). However, these prices reflect neither the environmental nor the public health costs from emissions of carbon dioxide and volatile organic compounds. When social and environmental costs are included in the price comparison, oil combustion, nuclear fission, and coal are among the highest cost technologies, whereas efficiency, wind, and biomass are among the lowest-cost technologies (DeAngelis and Rashkin 1989).
Optimal conditions for the economical development of wind power include high wind speeds, low interest rates, and low labor costs. At over $1,000 per installed kilowatt, high capital costs can be a problem when capital or loans are not available, or where interest rates are high. However, because wind is a clean energy source, it may be possible for developing countries to obtain loan subsidies from industrialized countries. Such loan subsidies have been proposed in the clean development mechanism in Article 12 of the Kyoto Protocol (U.N. 1997).
The cost of wind power depends on many factors. The most important are
the cost of the turbines and the average wind speed at the installation
site. Other factors that could affect the price of wind power in Eritrea
include the cost of land and labor, financing charges on loans, and need
for new transmission lines. An approximate breakdown of U.S. wind farm
construction costs is shown in Table 2. It is expected that many costs,
particularly land and permitting costs, would be substantially lower in
Eritrea.
| Component |
|
||
|
|
|||
| Wind turbine |
888
|
||
| Substation |
68
|
||
| Transmission |
6
|
||
| Service Center |
5
|
||
| Land |
40
|
||
| Indirect/Permitting |
26
|
||
| Total |
1032
|
||
Factors that could vary considerably in the Eritrean context are discussed individually below.
The effect of wind speed on cost. The cost of wind-generated electricity depends on both the mean annual wind speed and the annual distribution of wind speeds. Figure 2 shows the effect of changes in the average annual wind speed on the cost of wind power using the Mod-5B Horizontal Wind Turbine (Spera 1994).
Land costs. Data suggest that land costs have not contributed significantly to the price of wind energy in the United States. According to Table 2, land costs were less than 5% of installation costs. Therefore, we can conclude that low land costs in Eritrea will not offer a very substantial savings relative to current cost estimates based on U.S. and European experience.
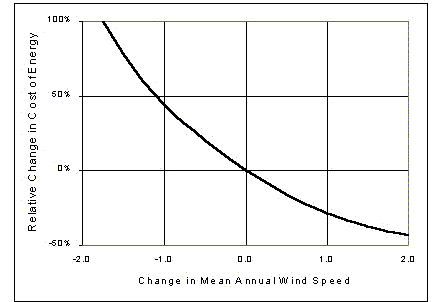
Figure 2. Effect of wind speed on cost of wind-generated electricity
Turbine costs. The cost of the turbines is the largest portion of any wind power project cost. Based on experience in the U.S. and Europe, turbines typically comprise more than 70% of the total wind plant installation costs (Table 2); therefore, the price of the wind turbines is critical in determining the cost-effectiveness of the wind system.
Turbine costs are generally the least uncertain of the component costs, and can be fairly well predicted for any given project. It is possible, however, for turbine costs to vary considerably. For example, in California, the price charged for the same machine installed at about the same time has varied by as much as 80%, where the higher price was charged to the site with better wind potential (Gipe 1995). Thus, prices for wind machines may be determined by the market in a somewhat inconsistent manner.
Another factor that could change the cost per installed watt is the
size and type of wind machines installed. Prices given in Table 2 are based
on U.S. and European experiences, which involved larger and more complicated
machines. Such machines may not be appropriate in the Eritrean context
as described in Wind Turbine Technology above. It is important to
consider, therefore, whether smaller machines will have higher installed
costs because of the lost opportunity of economies of scale. Data from
Gipe (1995) suggest there will be little cost compromise of using smaller
machines. A summary of this data is given in Table 3.
|
|
|
|
|
|||
|
|
|
|
|
|||
|
|
|
|
|
|||
| Micro-Turbines |
|
|
$2,500
|
|
||
|
|
|
$5,000
|
|
|||
| Small Turbines |
|
|
$10,000
|
|
||
|
|
|
$30,000
|
|
|||
| Medium-Sized
Turbines |
|
|
$125,000
|
|
||
|
|
|
$250,000
|
|
|||
|
|
|
$500,000
|
|
|||
|
|
|
$600,000
|
|
|||
Although economies of scale are apparent in the micro-turbines and small turbines, at about 100 kilowatts these economies of scale fall off, so that the 100-300 kilowatt turbines are nearly as cost-effective as the 400-500 kilowatt turbines. Furthermore, Gipe (1995) cites many individual examples of German wind turbines for which the price per kilowatt is actually less for 80 - 100 kilowatt turbines than for the larger 450 - 500 kilowatt turbines.
Financing charges on loans. Since approximately 80% of wind generation costs are capital costs, loan repayment could have a large impact on wind energy development costs. Loan repayment costs depend mainly on project lifetime and interest rates. Project lifetimes tend to be about 25 years, but interest rates can vary substantially. Gipe (1995) reports a range of annual interest rates from 3.3 percent in Germany to 10.1 percent in Great Britain. Annual interest rates on wind projects for private utilities in California were reported to be 10.5 percent (Brower et al.1993). However, for developing countries like Eritrea, there is a possibility of obtaining interest free loans or grants to develop wind projects (U.N. 1997).
Operation and maintenance. The final cost of energy will also depend on operation and maintenance costs. Operation and maintenance costs in the U.S. and Europe average about 1 cent per kilowatt-hour. This is about half the cost of operation, maintenance and fuel for nuclear and coal plants, and about one third of the cost of the same for gas plants (Gipe 1991).
Labor. More research needs to be done to determine what fraction of U.S. and European installation, operation and maintenance costs are attributable to labor wages. Labor costs, which are usually substantial in the U.S. and Europe, should be lower in Eritrea, resulting in substantial cost savings. In addition, the local manufacture of components such as towers or rotor blades could further reduce costs.
Because the cost of wind energy development depends sensitively on the nature of the wind resource, any detailed evaluation of wind energy economics requires a series of wind assessment studies. A wind energy assessment is an integrated analysis of the potential wind energy resources of a particular area. Such an assessment begins with an understanding of the general wind patterns of the area, and progresses to the collection and analysis of wind data. Wind assessment may also involve a monitoring program and, at the most advanced stages, computer simulations of wind flow to determine wind turbine micro-siting. In this study we focus on regional wind flow patterns, and the collection, evaluation and analysis of existing wind data.
To predict the windiest spots in a large area - for example, an entire country - it is useful to understand regional wind flows. Air flows from place to place as a result of differences in air pressure. Natural forces cause air in higher pressure systems to move in the direction of lower pressure systems. This movement of air is called wind.
There are two major forces that drive and direct the wind. The first is heat from the sun. As the sun heats the earth, air at the surface becomes less dense. Since the sun's intensity and the earth's heat capacity vary on local and global levels, multi-scale differential pressure systems are formed. In coastal regions, for example, the land heats and cools more quickly than the nearby water. The effect is that the hot air over the land rises during the day and is replaced by the cooler, denser air from over the sea. In the evening, the temperature of the land drops more quickly than the temperature over the water, and the effect is reversed. This is known as a sea breeze. Examples of this phenomenon can be found at California's Altamont pass and in Eritrea's highland passes. In a similar way, continent-sized pressure systems drive larger-scale regional winds.
The second major force that influences the wind is the rotation of the earth, which causes what is called the Coriolis effect. As described above, natural forces tend to drive winds in a straight line from areas of low pressure toward areas of high pressure. However, because the earth is turning under the wind, the path of the wind from the perspective of a fixed location on the earth appears to be curved - to the right in the Northern Hemisphere, or to the left in the Southern Hemisphere. The result is that the wind moves nearly parallel to isobars instead of across them. Therefore, in the Northern Hemisphere, air movement around a high pressure system is clockwise, while movement around a low pressure system is counterclockwise. The direction of air movement around pressure systems in the Southern Hemisphere is just the opposite.
The combination of these forces gives rise to many types of wind that may contribute to the wind resource of a given area. On a planetary level, trade winds extend from the equator to about 30 degrees latitude in both hemispheres, while westerly winds extend from about 30 to about 65 degrees latitude in both hemispheres. Monsoons are seasonal winds caused by large annual temperature and pressure differences over land and sea areas. Synoptic scale winds are associated with periodic systems, typically spanning a period of about 3 to 5 days. Mesoscale wind systems are generally associated with topographical features, including physical and differential heating elements. Breezes are the mesoscale equivalent of monsoons, lasting only a few hours, often on a daily basis (Aspliden, Elliott and Wendell 1986).
Local topography physically affects winds at the earth's surface. Over relatively level terrain, winds are slowed by friction at the earth's surface so that wind speeds tend to increase with height. Wind speeds can be enhanced through constriction over hills or through valleys due to the conservation of mass principle, which implies that a volume of air forced through a smaller area will travel faster than the same volume of air forced through a larger area.
The many types of winds and the physical elements that affect them must be taken into account when estimating the wind potential for a given region. Topography and major wind flows contributing to wind patterns in Eritrea are discussed in Chapter 4.
Wind Data Collection
Once an area has been chosen for assessment, it is necessary to collect wind speed and direction data. A complete wind resource assessment involves a dense network of anemometers (wind monitoring stations) recording continuous wind data for at least one year. Since such wind monitoring efforts are time consuming and costly, wind researchers often obtain data sets that have been previously recorded.
There are several sources that may be helpful in obtaining existing meteorological databases. Climatological stations and airports are likely to maintain reliable records. The World Meteorological Organization maintains a record of such stations worldwide. For resource assessments conducted near coastal areas, marine wind information taken from ships, buoys and satellites may also be useful. For details on these and other data sources that were examined in the context of this study, see Appendix A.
If possible, existing data sets should be supplemented with spot measurements. When choosing sites to examine for potential wind development, the researcher should focus on areas likely to have enhanced wind speeds. Some topological features that are likely to enhance wind speeds are (Aspliden, Elliott and Wendell 1986):
The next step in the wind resource assessment is to analyze the wind data set to determine patterns in the magnitude, duration and direction of the wind.
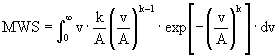
Mean wind speeds. Mean wind speed (MWS) is the most commonly used indicator of wind production potential. A mean annual wind speed (MAWS) of about 6 meters per second at 10 meters height is considered economically viable for a utility-scale wind farm (Grubb and Meyer 1993). The mean wind speed is defined as:
where N is the sample size, and vi is the wind speed recorded for the ith observation.
Where the sample size is large, it is useful to group the wind speed data into intervals to create a histogram of the wind speed distribution. The probability of the observed wind speed being within an interval can be written as:
where vj is the median value and nj is the number of observations in the jth interval. The mean wind speed can then be calculated as:
where M is the number of intervals, or:
where f(v) is the non-cumulative probability distribution function.
The Weibull distribution. Studies show that a wind speed distribution can typically be described in terms of the Weibull distribution (Rohatgi and Nelson 1994). The equation of the cumulative Weibull distribution is:
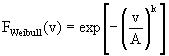 (5)
(5)and the non-cumulative Weibull distribution is:
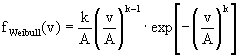 (6)
(6)where k is the shape parameter and A is the scale parameter. Finding a "best fit" Weibull distribution is a convenient way to approximate a continuous wind speed distribution from the discrete observed values. In addition, this method is also useful in that the wind regime of an area can then be described using only the two Weibull parameters, k and A.
Once Weibull parameters have been determined, mean wind speeds can be computed as (from Equations 4 and 6):
 (7)
(7)This equation can be simplified using the Gamma function, defined as:
Setting (v/A)k = t and (z - 1) = 1/k, mean wind speed can then be expressed as:
Vertical estimation of wind speed using the power-law model. As described above, winds are slowed by friction at the earth's surface, so that wind speeds tend to be greater at higher elevations. The standard height for wind speed observations is 10 meters (WMO 1996). Since wind turbine hub heights are typically between 20 and 50 meters, extrapolation of wind speeds to the planned hub height is usually required to estimate wind potential. For regions with relatively level terrain and little vegetation, the method most commonly used to obtain this extrapolation is the 1/7 power-law model. The equation of the 1/7 power-law model is:
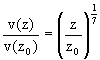 (10)
(10)where z is the height at which the wind speed is to be estimated, ![]() is
the wind speed to be estimated, and
is
the wind speed to be estimated, and ![]() and
and ![]() are
the reference height and wind speed, respectively.
are
the reference height and wind speed, respectively.
Temporal wind speed patterns. Temporal wind speed patterns are useful to determine when the greatest wind energy potential exists. Depending on the region, wind resources can vary from year to year, seasonally, from day to day, diurnally, and even from minute to minute. Long-term means for wind speed and direction are most important for estimating power output at a given site, but seasonal and diurnal variations are important when considering peak demand and power supply. Variations of very fine temporal resolution, although necessary for choosing appropriate wind turbines, are beyond the scope of this study. Temporal wind speed patterns in Eritrea are presented in Chapter 6.
Theoretical Capacity Factor. For future estimates of potential wind power plant output, it is useful to derive a theoretical capacity factor. The capacity factor is a measure of power plant efficiency, defined as the ratio of actual energy output to the amount of energy a plant would produce if it operated at full rated power within a given time period. The best sites are those with wind regimes that allow the turbines to run at their maximum output the largest fraction of the time. In California wind farms, operating capacity factors for 200-kilowatt turbines are observed to be approximately 22% (Lynette and Gipe 1994).
The theoretical capacity factor (CF) is estimated by the equation:
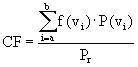 (11)
(11)where a is the cut-in speed of the turbine, b is the cut-out speed, P(v) is the power curve for the turbine, and Pr is the rated power capacity of the turbine. The power curve and rated capacity are turbine-dependent and must be obtained from the turbine manufacturer.
Wind power. Calculations of wind power are derived from the equation for kinetic energy (KE), which is:
where m is mass. Air mass is equal to the product of its density and volume. Volume is dependent on the area through which the air is passing, the speed with which it is moving, and the amount of time it travels. Air mass can therefore be calculated as:
where ![]() is the air density,
A is the area through which the air passes, and t is time. Since power
is energy divided by time, the equation for wind power (WP) can be written
as:
is the air density,
A is the area through which the air passes, and t is time. Since power
is energy divided by time, the equation for wind power (WP) can be written
as:
Wind power density. Wind power density is the amount of wind power available per unit of area perpendicular to the wind flow. In practice, wind power density is used to estimate the potential electrical output of a wind farm once the area swept by wind turbine rotors and the power system efficiency are known. The equation for wind power density (WPD) is simply the wind power (Equation 14) divided by the area, or:
Wind power class. In the U.S. Wind Atlas (Elliott et al. 1986), wind power class denominations of between 1 and 7 are used, where a wind class of 7 indicates the highest potential. Table 4 compares these methods of describing wind resource potential.
|
|
|
|
|
|
|
|
|
|
|
|
|
|
|
|
|
|
|
|
|
|
|
|
|
|
|
|
|
|
|
|
Power output. Power is extracted from the wind as it moves through the area swept by a turbine's blades. Using equations 11 and 15, the amount of power (P) converted to electricity by a wind turbine with radius r, can be written as:
where ![]() is the area swept
by the wind turbine rotors.
is the area swept
by the wind turbine rotors.
On the down-wind side of a turbine, the wind speed is reduced because kinetic energy has been taken by the turbine. As a result, less wind power is available to a turbine sited downwind of another. Therefore, when calculating the power output of an array of turbines, P must be multiplied by the efficiency of the array.
Wind direction. Wind direction is usually described in terms of degrees, where north is 360°, south is 180°, east is 90° and west is 270°. In assessing wind resource potential, wind direction frequency distributions are typically calculated for 8, 12 or 16 direction intervals. The probability that the wind will blow from within a given direction interval is:
where Dj is the median value of the jth interval. Results are often displayed on a wind rose, which is a radar graph where direction (degrees) is plotted on the circular x axes, and frequency (%) is plotted on the y-axes.
A wind map indicates regions of equal wind speeds. Such maps have been generated for the U.S., Europe, and many other regions. Approaches to creating wind maps depend on the nature of regional wind flows, the complexity of the terrain, and the availability of climatic station data. In regions with very simple terrain, predictable regional wind flows, and reasonably dense monitoring networks, wind maps may be generated using simple extrapolations of meteorological station data, such as was done in the wind assessment of Somalia by Pallabazzer and Gabow (1991). For somewhat more complex terrain, station data may be extrapolated using commercially available models that estimate perturbations due to uneven terrain. Such models are not suitable for Eritrea due to the complexity of the terrain. In addition, large-scale vertical movements of air masses, such as can be found in Eritrea, cannot be described using these models.
In Eritrea, thermally driven winds and extreme elevation changes cause regular disruptions in regional wind flows. Under these conditions, locations only a few kilometers apart may show little or no correlation in wind speed and direction. Standard wind modeling methods are not well defined for such sites. Because of the complexity of the wind flows and terrain, and the limited number of meteorological stations for which wind speed data are available, this study will not attempt to create a wind map for Eritrea. Instead, the results of this study will identify high wind areas for further study.
In the following chapters, this understanding of wind assessment will be applied to the specific case of Eritrea.