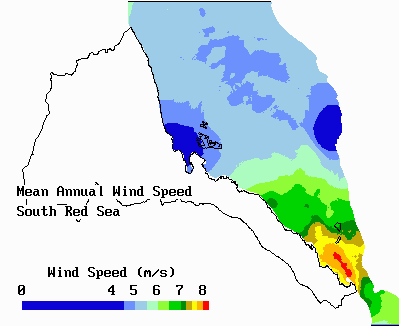
Coastal Wind Speeds: Eritrea


Then for each point on the map, two quantities are calculated. The first quantity is a gaussian-weighted wind:
WIND-SUM = SUM OF (WS*EXP(-(R^2)/(R0^2)))
where WS is the wind speed, R is the distance between the data point and the point of interest, and R0 is the averaging distance. The second quantity is the sum of the weights:
WEIGHT-SUM = SUM OF (EXP(-(R^2)/(R0^2)))
These two quantities are calculated for progressivly larger R0 starting from R0= 10 kilometers to R0 = 150 kilomters. When the weight-sum exceeds 30, it is considered that there is enough data to calculate an average, and the average is calculated as the ratio of the wind-sum and weight-sum for that location.
Hence, an average wind speed map is calculated for four periods of the day for both the High-wind and Low-wind seasons. The average of the four periods is taken to get the average for each season. To obtain the annual average, 5/12 of the Low-wind season average is added to 7/12 of the High-wind season average.
-Robert Van Buskirk