K. Rosen(2) , K. Garbesi(2) , and R. Van Buskirk(1)
(1)Department of Energy, P.O. Box 5285, Asmera, Eritrea
(2)Department of Environmental Studies, San Jose
State University, San Jose, CA 95192-0116, U.S.A.
Note Re: Corrections: Text recommended for insertion will be included in square brackets, [], while text recommended for deletion will be included in curly brackets {}.
Comments: Some of the comments may be obvious, and if so, please disregard.
Figure 1 needs to be completed and inserted.
For the Aseb Map figure...in addition to labeling and a caption,
The location of the stations seems a bit off. This is perhaps due
to the wind symbols being centered on the locations. If the round dots
on the wind symbols could be centered on the station locations, that would
be great
For equation #1, it should be :
t(v) = 1 (at v=0)
t(v)=(1-s)* exp(-(v/A)k) (for v>0)
where t(v) is the fraction of time that the wind velocity is larger
than or equal to the velocity v.
Or if you want to describe it in terms of the frequency function,
you can say:
f(v) = s (at v=0)
f(v) = k*(1-s)*(vk-1/Ak)* exp(-(v/A)k)
where f(v)*dv is the fraction of time the velocity data is in a
bin centered at v, with bin size dv.
For the statement in the discussion, where you state that the cost
would be less than half the current cost of deisel generation at 6 cents
per kWh. How do you want to support this statement, by reference
or calculation??
Abstract
This paper describes an analysis of historical surface wind data for the small country of Eritrea, in northeastern Africa. Winds in this region are directed by summer and winter monsoons in addition to diurnal land-sea effects. Initial findings indicated areas of outstanding potential for utility-scale wind development along the southern coastline. Further analysis of data recorded at the Aseb airport between 1977 and 1986 indicate a mean annual wind speed of 9 m/s [at 10 m height] and a mean annual wind power density of just under 1 kW/m2. An analysis of Red Sea wind data implies that similar potential may be found along the lower 200 km of the Eritrean coastline.
Introduction
The Eritrean Department of Energy is currently in the process of investigating the availability and suitability of a variety of power sources needed to rebuild the Eritrean infrastructure after several decades of civil war. This wind prospecting study was undertaken to supply the Eritrean Department of Energy with information about wind resources in Eritrea.
Mulugetta and Drake (1996) conducted a study of wind potential for Ethiopia, Djibouti, and Eritrea. Their results indicate the highest potential for wind development along the Eritrean coastline. Other studies of the region surrounding the Red Sea and Gulf of Aden have also issued promising results for coastal areas (Elliott & Renne 1987; Pallabazzer & Gabow 1991; Radwan 1987). This study provides a more detailed account of the wind potential in Eritrea and discusses the feasibility of wind power integration at the southern Eritrean port city of Aseb.
Study Area
Eritrea occupies the southernmost 1200 km of the Red Sea [western] shoreline, including hundreds of islands near the major ports of Mitsiwae in central Eritrea and Aseb in the south. The capital of Asmera is located in central Eritrea on a plateau at over 2000 meters elevation. This high plateau and the surrounding hillsides are known as the central highlands. To the west and east are the western and coastal lowlands, respectively. The western lowlands consist chiefly of desert hills and savanna. To the east, the high plateau drops abruptly to a wide, arid coastal plain, which stretches the entire length of Eritrea. South of Mitsiwae, the coastal plain dips to 100 meters below sea level at the Danakil depression, which divides the central highlands in the west from a much smaller range of mountains in the east. This second range parallels the shoreline from the Danakil depression to beyond the Djibouti border, reaching [almost] {less than} 2000 meters at its highest point.
Demographics and Infrastructure
The population of Eritrea is estimated at 3.6 million. Of that number, roughly 20% inhabit [the capital] Asmera {and}[on] the high plateau. Although accurate population counts for other major cities are not available, it is estimated that more than half of the Eritrean populace lives in the towns and cities of the highlands.
Aseb is a port city of about 50,000 people located at the southernmost tip of the Eritrean coastline. This area is extremely hot and dry. Summer temperatures from June to September average {40-50ºC}[35-45ºC] and rain is rare. Drinking water is available through ample groundwater resources. The economy here relies on the port, the national petroleum refinery and a small fishing industry.
The main national electric grid has a [formal] capacity of 40 megawatts. It stretches from Mitsiwae to Asmera, and then continues south to Adi Quala for a combined length of about 500 kilometers (see Figure 1). A second grid, with a capacity of 17 megawatts, is located at Aseb. [In practice, the actual generation capacity is approximately one half the formal generation capacity because many generators are out-dated and inefficient.]
Climate
Wind patterns in the Red Sea region are controlled to a large extent by two distinct monsoons that are separated by 30 to 45 days each. The Northeast Monsoon dominates the southern half of the Red Sea from November to March. The African equatorial low centered at 10N 30E creates a strong southeast wind that is pulled through the narrow Bab el Mandeb at the southern mouth of the Red Sea. This wind slows as it continues toward Mitsiwae where it converges with the northwest wind. Much of this air mass is drawn southwestward across the Eritrean highlands toward the African equatorial low pressure system centered in southern Sudan. During the Southwest Monsoon from May to September, the warm Pakistani low formed at 30N 65E causes surface winds along the entire length of the Red Sea to blow from the northwest, down the length of the Red Sea, and out into the Gulf of Aden (US Navy, 1993).
Study Overview
Our original goal was to use existing data to locate potential sites for utility-scale wind power development in Eritrea. We began our study by searching for historical wind information. In the course of this search, we discovered that {most}[much] historical wind data was lost with the removal of Ethiopian occupation in 1991. However, four sources of wind information were found: recent Eritrean station data, historical Italian station data, US Air Force DATSAV2 surface records, and a climatic study of the Red Sea conducted by the U.S. Navy. These data sources are described in detail below.
Weather monitoring efforts are conducted at 7 stations located in towns and cities scattered throughout the highlands and western lowlands of Eritrea. The Eritrean Department of Water Resources began recording continuous 15 minute wind speed averages in 1994. Accurate mean annual wind speeds could not be derived because data available at the time of this study spanned less than one year, so rough estimates were derived and summarized in Table 1.
Table 1: Mean annual wind speeds based on Eritrean station data (1994-1995)
| Station | Geographical Coordinates |
|
|
| Asmera | 15º 17´ N | 38º 55´ E |
|
| Filfil | 15º 36´ N | 38º 57´ E |
|
| Kerkebet | 16º 18´ N | 37º 24´ E |
|
| Omhajer | 14º 20´ N | 36º 39´ E |
|
| Shambiko | 14º 57´ N | 37º 53´ E |
|
| Sheb | 15º 51´ N | 39º 03´ E |
|
| Tsorena | 14º 39´ N | 39º 13´ E |
|
Daily average wind speeds were recorded at [more than] four stations {along the Italian-built railroad line from Mitsiwae to Keren} during the Italian occupation in the early 1930's. Mean annual wind speeds at {these} four [available] stations are provided in Table 2.
Table 2: Mean wind speeds based on historical Italian station data
| Station | Geographical Coordinates |
|
|
| Asmera | 15º 17´ N | 38º 55´ E |
|
| Faghena | 15º 10´ N | 39º 28´ E |
|
| Keren | 15º 46´ N | 38º 27´ E |
|
| Mitsiwae | 15º 37´ N | 39º 27´ E |
|
Hourly wind speed records for the three Eritrean cities of Asmera, Mitsiwa'e and Aseb were available. However, since we already had fairly good data for both Asmera and Mitsiwa'e, we chose to obtain and analyze only the Aseb data set. [A brief analysis of this data set indicated a mean annual wind speed of about 8 m/s at Aseb (42º 43' E 12º 58' N).]
While wind power generation in the highlands appears uneconomical according to these results, one must keep in mind that the highland stations were not sited for wind prospecting purposes and so are unlikely to be recording the highest wind speeds in the region. VanBuskirk et al. (1997) suggest that the channeling of wind through the hills and valleys of the highlands will create areas in which wind speeds are significantly enhanced. The Eritrean Department of Energy has been collecting additional wind data in the mountain passes near Asmera in an attempt to locate such sites. Some sites with mean annual wind speeds of 5 m/s have already been found (VanBuskirk 1998).
The initial study of Aseb and Red Sea winds produced more promising results than did the study of winds in central Eritrea. The unweighted arithmetic mean of the complete DATSAV2 data set for Aseb (1973-80, 82-91) is 8 m/s. In addition, the Naval report for the Red Sea indicates mean monthly wind speeds as high as 10 m/s just off the southern coast of Eritrea. Although demand at Aseb is not as great as at Asmera, we chose to pursue a [more] detailed study of this area based on the {notable} [existing] wind speeds recorded there.
Methods
This study will attempt to provide the following estimates for two sites at Aseb:
The Eritrean Civil Aviation Department maintains two stations at Aseb: one at the airport about 10 km northwest of Aseb, and one at the seaport within the city. The airport station is located in a flat, open plain at about 10 meters elevation. The seaport station is at the shoreline, surrounded by buildings [on the northwest side. The data consists of human estimates of wind speeds by trained personnel of the Eritrean and/or Civil Aviation Department].
Until the end of Ethiopian occupation in 1991, weather observations recorded every 3 hours were archived by the United States Air Force Environmental Technical Application Center (USAFETAC) in the DATSAV2 Surface Database. Observations reported before 1986 were taken at the airport station, while observations reported after 1986 were taken at the seaport station. The National Climatic Data Center (NCDC) provided a data set containing thirteen full years (1977-79, 1982-91) of DATSAV2 Surface observations for Aseb. After removing incomplete or otherwise inconsistent data records, over 5,000 observations remained for each station.
Division of Data
As discussed above, weather patterns at Aseb can be divided into two distinct seasons. For this analysis, results of the Naval study were used to divide the entire multi-year data set into two subsets corresponding to the two seasons. From this point on, May to September will be referred to as the summer monsoon season while October through April is referred to as the winter monsoon season.
Each seasonal subset was further divided according to whether the observations were recorded at the airport or the seaport station. The resulting four subsets were analyzed independently, with initial results presented in Table 3.
Table 3: Initial results of an analysis of wind speed at the two Aseb stations
|
|
|
|
|
|
| N of observations |
2593
|
3258
|
1899
|
3244
|
| Minimum |
0.0
|
0.0
|
0.0
|
0.0
|
| Maximum |
31.0
|
42.2
|
30.0
|
44.0
|
| Arithmetic mean |
7.7
|
12.1
|
4.8
|
9.1
|
| Variance |
18.3
|
25.0
|
13.1
|
20.8
|
| Standard deviation |
4.3
|
5.0
|
3.6
|
4.6
|
| Standard Error |
0.08
|
0.09
|
0.08
|
0.08
|
| Skewness (g1) |
0.26
|
0.14
|
0.92
|
0.21
|
| Kurtosis (g2) |
0.19
|
1.33
|
1.64
|
0.92
|
At this point, we found that records for late evening and early morning hours did not begin to appear on a regular basis until after the observation site was moved to the seaport. Of the 16 data subsets for the airport, 6 contained insufficient data for analysis: 21:00, 00:00 and 03:00 for each season. Figure 3 illustrates the data divisions and the number of observations in each subset.
Figure 3: Division of DATSAV2 data for the two stations at Aseb
|
|
|
||||||||||||||||
|
|
|
|
|
|
|
|
|
|
|
|
|
|
|
|
|
||
| Summer |
|
|
|
|
|
|
|
|
|
|
|
|
|
|
|
|
|
|
|
|
|
|
|
|
|
|
|
|
|
|
|
|
|
|
||
| Winter |
|
|
|
|
|
|
|
|
|
|
|
|
|
|
|
|
|
Analysis
To account for the missing data, we assumed similar wind regimes at the two stations, as they are separated by less than 10 kilometers of relatively flat, open land. To provide very rough estimates of the missing data at the airport, therefore, we plotted wind speed averages and Weibull parameters to determine correlations between the sites.
Calculation of Mean Wind Speeds
To derive the mean annual wind speed at the airport, it was necessary to estimate mean wind speeds for the subsets with insufficient data. First, mean values were calculated for the subsets at both the airport and seaport that contained sufficient data. Using regression analysis, linear correlations were derived between the time-correlated pairs of mean wind speeds at the two stations (R2 = 0.96). Each of the three missing values for the two seasons were then calculated as µa=m·µs+b, where µa and µs are the mean wind speeds at the airport and seaport respectively, and m = 1.043, and b = 2.179 are the slope and y-intercept found in the regression analyses, respectively.
Calculation of Frequency Distributions
To account for the uneven distribution of observations among the 3-hour bins, we planned to determine a frequency distribution for each subset, and then average the distributions to obtain the seasonal and annual wind speed frequency distributions for each site. As described above, however, subsets for the airport station contained insufficient data to calculate the wind speed frequency distributions. To estimate these distributions, we planned to calculate Weibull parameters for the subsets with sufficient data, and then use them to estimate the Weibull parameters for the subsets with insufficient data. From these estimated parameters, model distributions for these subsets could then be constructed.
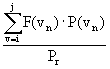
At this point it became clear that the wind speed database for Aseb contained a large number of calms. This presented a problem because the standard Weibull distribution does not allow for a wind speed of zero. To resolve this problem, we employed a method described by Mulugetta and Drake (1996) in which a Weibull distribution is fit to the observed distribution above 0 m/s, and calms are considered separately. This method tends to provide a more conservative estimate of mean wind speed by assuming that the reported frequency of calms is correct, whereas the standard Weibull distribution assumes that the frequency of calms is zero. This is particularly important in the case of the Aseb data, where the observed frequency commonly drops abruptly between 0 and 1 m/s, and then follows the expected Weibull distribution closely.
To the standard Weibull parameters of k and A is added a variable s
denoting the frequency of calms The equation of the modified Weibull distribution
then becomes:
 (1)
(1)where v is the wind speed, s is the frequency of observations at wind speed zero (calms), A is the magnitude parameter, and k is the shape parameter (similar to the kurtosis of a normal distribution).
For each season, this modified Weibull model was fit to the wind speed frequency distributions for the 13 subsets containing sufficient data. A best fit was obtained by minimizing the root mean square (RMS) between the observed frequency distribution and the Weibull distribution.
The modified Weibull parameters of k, A and s were calculated for each subset. To determine correlations between the parameters at the two stations, time-correlated parameters were plotted as shown in Figure 4.
The plot of the k parameters found at the Aseb airport and seaport did not indicate a good correlation. We therefore chose to use the average of the k values for each season to fill in for the missing k values. For both A and {z}[s], acceptable linear correlations were determined between the two stations. The missing values were then calculated as y = m·x + b, where y and x are the parameters at the airport and seaport respectively, and m and b are the slopes and y-intercepts found in the regression analyses.
According to the modified Weibull method, mean wind speeds are calculated as (Mulugetta & Drake 1997):
To obtain seasonal wind speed frequency distributions for the airport, the 5 observed and 3 estimated frequency distributions for each season were averaged. Seasonal wind speed frequency distributions at the seaport were simply calculated as the average of the eight observed frequency distributions. Because the summer season has 5 months and the winter season 7, annual distributions for each station were calculated as:
To summarize the wind regime at the two Aseb sites, the modified Weibull distribution was fit to the annual wind speed distributions to derive Weibull parameters [for the aggregated data].
Calculation of Power in the Wind
Wind power density is the amount of wind power available in a plane perpendicular to the direction of the wind. In this study we describe wind power density in units of watts per square meter (W/m2). In practice, wind power density is used to estimate the potential electrical output of a wind farm by multiplying it by the anticipated area swept by the wind turbine rotors. In this study we calculate the mean annual wind power density as
For future estimates of potential wind farm output, it is also useful to derive a theoretical capacity factor. Capacity factor is defined as the ratio of actual energy output to the amount of energy a project would produce if it operated at full rated power within a given time period. The best sites are those with wind regimes that allow the turbines to run at their maximum output the largest fraction of the time. In California wind farms, operating capacity factors for 200-kW turbines are observed to be approximately 22% (Lynette and Gipe 1994).
The potential capacity factor is estimated by
 (5)
(5)Results
The results of this analysis are presented below.
Wind speeds
The results presented here represent wind speeds at 10 meters height. It is expected that wind speeds at typical turbine hub heights of 30 meters or greater would be higher than those presented here. However, winds have been known to decrease with height, particularly in hilly areas. Therefore, we have chosen to present values at 10 meters without making any assumptions about the wind speeds at higher hub heights.
Table 5: Mean wind speeds at 10 m height at the two Aseb stations
|
|
|
||||||
|
Time
|
Summer |
|
|
Summer |
|
|
|
|
6:00
|
3.6
|
7.8
|
6.0
|
2.1
|
5.8
|
4.3
|
|
|
9:00
|
6.0
|
11.2
|
9.0
|
3.8
|
8.0
|
6.2
|
|
|
12:00
|
8.9
|
13.1
|
11.3
|
5.6
|
10.2
|
8.3
|
|
|
15:00
|
9.3
|
13.6
|
11.8
|
6.2
|
10.8
|
8.9
|
|
|
18:00
|
8.8
|
11.8
|
10.5
|
6.1
|
10.6
|
8.7
|
|
|
21:00
|
7.9
|
11.6
|
10.1
|
5.2
|
9.2
|
7.5
|
|
|
0:00
|
6.1
|
10.9
|
8.9
|
3.9
|
8.4
|
6.5
|
|
|
3:00
|
5.2
|
10.1
|
8.0
|
3.2
|
7.6
|
5.8
|
|
| Average |
7.0
|
11.3
|
9.5
|
4.5
|
8.8
|
7.0
|
|
Table 6 shows the parameters obtained using modified Weibull fits to the observed wind speed distributions as described in the Analysis under Calculation of Frequency Distributions. Again, values for 21:00, 0:00 and 3:00 are estimated as described above. Mean wind speeds presented in Table 6 are based on Equation 2.
Table 6: Modified Weibull parameters and resulting wind speeds at 10m height
|
|
|
||||||||
| Time |
k
|
A
|
s
|
MWS
|
k
|
A
|
s
|
MWS
|
|
| Summer | |||||||||
| 6:00 |
2.1
|
6.6
|
0.41
|
3.5
|
2.0
|
3.8
|
0.49
|
1.7
|
|
| 9:00 |
1.9
|
7.5
|
0.10
|
6.0
|
2.0
|
4.5
|
0.21
|
3.2
|
|
| 12:00 |
2.9
|
9.8
|
0.00
|
8.7
|
2.2
|
6.1
|
0.07
|
5.0
|
|
| 15:00 |
2.7
|
10.3
|
0.00
|
9.2
|
2.2
|
6.7
|
0.02
|
5.8
|
|
| 18:00 |
3.2
|
10.0
|
0.00
|
8.9
|
2.0
|
6.9
|
0.05
|
5.8
|
|
| 21:00 |
2.6
|
8.7
|
0.06
|
7.3
|
2.0
|
5.6
|
0.10
|
4.5
|
|
| 0:00 |
2.6
|
8.1
|
0.11
|
6.4
|
2.1
|
4.8
|
0.16
|
3.6
|
|
| 3:00 |
2.6
|
7.9
|
0.25
|
5.2
|
2.3
|
4.5
|
0.32
|
2.7
|
|
| Summer Avg. |
2.3
|
8.8
|
0.12
|
6.9
|
2.0
|
5.5
|
0.18
|
4.0
|
|
| Winter | |||||||||
| 6:00 |
2.4
|
10.0
|
0.10
|
8.0
|
2.0
|
7.6
|
0.12
|
5.9
|
|
| 9:00 |
3.2
|
12.8
|
0.02
|
11.2
|
2.5
|
10.0
|
0.06
|
8.3
|
|
| 12:00 |
3.3
|
14.7
|
0.00
|
13.2
|
2.6
|
12.4
|
0.03
|
10.7
|
|
| 15:00 |
3.5
|
15.3
|
0.00
|
13.7
|
3.0
|
12.9
|
0.01
|
11.4
|
|
| 18:00 |
3.8
|
13.4
|
0.01
|
12.0
|
3.4
|
12.6
|
0.02
|
11.1
|
|
| 21:00 |
3.2
|
13.3
|
0.00
|
12.0
|
3.2
|
11.1
|
0.03
|
9.6
|
|
| 0:00 |
3.2
|
12.1
|
0.02
|
10.6
|
4.1
|
9.7
|
0.06
|
8.2
|
|
| 3:00 |
3.2
|
12.1
|
0.02
|
10.6
|
3.2
|
9.6
|
0.05
|
8.2
|
|
| Winter Avg. |
3.4
|
13.2
|
0.02
|
11.4
|
2.4
|
10.3
|
0.05
|
8.7
|
|
| Annual Avg. |
2.4
|
11.5
|
0.06
|
9.6
|
1.8
|
8.9
|
0.10
|
7.1
|
|
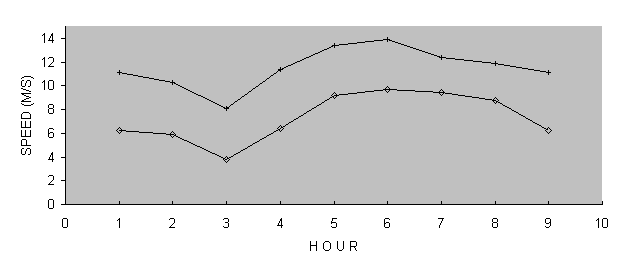
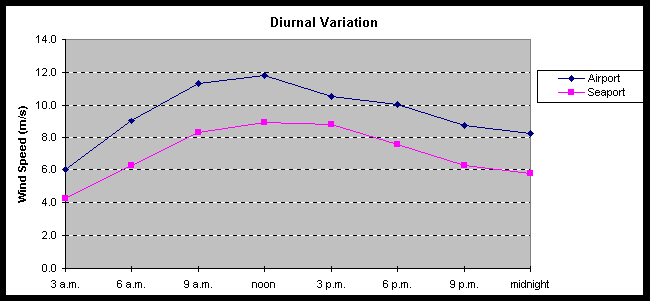
Figure 5 is a graph depicting the mean diurnal wind speed variation. Higher wind speeds at midday increase power supplies during peak demand. Here it is clear that the wind speeds at the two stations are closely related.
| Annual |
6:00
|
9:00
|
12:00
|
15:00
|
18:00
|
21:00
|
0:00
|
3:00
|
Average | |
| Airport |
6.0
|
9.0
|
11.3
|
11.8
|
10.5
|
10.1
|
8.7
|
8.2
|
9.5
|
|
| Seaport |
4.3
|
6.2
|
8.3
|
8.9
|
8.7
|
7.5
|
6.3
|
5.8
|
7.0
|
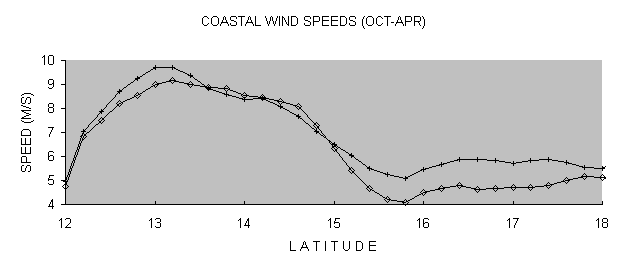
Figure 6 shows mean annual wind speeds in the Red Sea along the southern Eritrean coastline. It can be seen here that the high wind speeds found at Aseb on the southernmost tip of the Eritrean coastline continue for at least one hundred and perhaps as far as two hundred kilometers up the coastline. We expect that many excellent high wind sites will be found in this area.
Mean Annual Wind Speed Frequency Distribution
Figures 7 and 8 show the modified Weibull fits to the average of the observed 3-hour wind speed distributions at the Aseb Airport and Seaport. In Figure 8, the "observed" distribution at the Airport is the average of the 5 actual distributions and 3 predicted distributions as described in the Analysis section under Calculation of Frequency Distributions.
Projected available wind power
The amount of potential electricity that can be generated depends on several factors, including the spacing between wind turbines, the assumed efficiency of the machines, the turbine hub height, and the estimated energy losses. The assumptions used for calculating the wind energy potential per unit of land area is given in Table 7. (Estimates of wind turbine efficiency and power losses are based on data from existing turbines. For advanced turbines, efficiency is projected to be 30%-35% and power losses 10%-15%).
Table 7. Assumptions: 30-m hub height, 10Dx5D spacing, 35% turbine efficiency and 25% power losses
|
|
|
|
|
|
|
|
|
|
|
|
|
|
|
|
|
|
|
|
|
Wind Direction
Figure 8 shows wind roses for the summer and winter monsoons at Aseb. Once again, it can be seen that the winds at the two stations follow each other very closely. It is also noteworthy that during the winter monsoons, when winds are strongest, the wind blows predominantly from the southeast. This indicates that more efficient wind turbine spacing may be possible.
Method Summary
Before the discovery that there were two stations at Aseb (a fact not indicated in the data set), the annual average wind speed at Aseb appeared to be about 8 m/s. After dividing the data set accordingly, we encountered many problems in finding an accurate estimation of mean annual wind speeds at these two stations. Table 8 provides a summary of the Weibull parameters, mean annual wind speeds and wind power densities obtained using different methods of data analysis.
Table 8: Summary of the Results of Different Data Analysis Methods
|
|
|
|||||||
|
|
|
|
|
|
|
|
|
|
| Unadjusted |
10.3
|
7.3
|
||||||
| Linear Correlation |
9.5
|
920
|
7.0
|
480
|
||||
| Modified Fit |
2.4
|
11.6
|
9.6
|
915
|
1.8
|
8.9
|
7.1
|
538
|
| Standard Fit |
2.5
|
11.7
|
10.4
|
1025
|
1.8
|
9.3
|
8.3
|
688
|
Discussion and Conclusions
The data analysis presented here indicates that the mean annual wind speed at the airport is about 9.5 m/s while the mean annual wind speed at the seaport is about {7.5 m/s}[7.0 m/s]. We attribute this difference to the different levels of wind exposure at the two stations [and the difference in surface roughness at a barren runway vs. an urban location]. The airport is located outside the city and has excellent wind exposure, whereas the seaport station is located in a developed area within the town.
According to these results, the Eritrean coastline has an outstanding wind resource, particularly in the Aseb area. Winds at Aseb are strong enough to generate electricity that costs less than half the electricity currently supplied by diesel at 6 cents per kWh. The large port facility at Aseb would be useful for transporting of the necessary machinery and equipment, while the wind power plant could take advantage of the already existing electrical infrastructure.
The main factor constraining wind power development near Aseb is its relatively small size. Grubb and Meyer (1993) reviewed studies of the potential wind energy penetration of utility grids. Those studies considered how much wind energy could be added before operating penalties of an intermittent source became larger than the benefits. Although the study results varied, typical simulation results were between 15 and 30%. With large grids and the incorporation of a diversity of out-of-phase intermittent sources, the estimated potential contributed was as high as 45% without reliance on storage. The combined capacity of the power system is approximately 17 MW. Taking the conservative end of the range, this suggests that the Aseb utility, without expansion, could accommodate no more than about 3 MW of wind, which could be supplied by 5 to 10 medium size turbines.
Another problem with the wind resource at Aseb is that the peak supply is in the winter, while the peak demand in the summer. One plan that would both further exploit the wind resource and level the seasonal loads is a cooperative effort with Ethiopia, in which winter wind power from Aseb is traded for summer hydropower from the Blue Nile region. [But t]his option may not be feasible due to [recent political conflicts with Ethiopia] {international instabilities}.
Another option for distributing excess supply may be to connect the power system at Aseb to the national grid in the central highlands. Although this option is preferable in many respects, construction of transmission lines along [the 500 km route] may be prohibitively expensive and power losses unacceptably high. [The excellent wind resource does however appear to extend as far as 14.5 degrees N Latitude. This location is approximately 300 kilometers from the central grid at Massawa, transmission to which may be feasible].
For full exploitation of wind energy potential in Aseb, measures need to be taken to increase the reliability of the city power distribution system (VanBuskirk 1998). Research continues to be conducted in the Eritrean highlands, but further investigation into power transmission from [the Southern Eritrean coast] {Aseb} to the highland area [is also] {may be} warranted.
Further funding for this project has been procured from the Global Environment Facility (GEF), a joint program between the United Nations Development Program (UNDP), United Nations Environment Program (UNEP) and the World Bank. A full scale wind prospecting effort will be undertaken under this grant. Results of the ensuing study are expected {within a} in approximately one year.
References
Elliott, D., Renne, S. 1987. "Wind Energy Resource Assessment of Egypt." Sixth ASME Wind Energy Symposium presented at the Tenth Annual Energy-Sources Technology Conference and Exhibition, Dallas, Texas, February 15-18. SED-Vol. 3.
The State of Eritrea Environment Eritrea Newsletter No. 4
Garbesi, K., Kello, K. & Van Buskirk, R. 1996. Preliminary wind energy resources assessment for Eritrea, Department of Energy, P.O. Box 5285, Asmera, Eritrea.
Garbesi, Rosen and VanBuskirk. 1997. "Wind Power In Eritrea, Africa: A Preliminary Resource Assessment." 1997 American Wind Energy Conference.
Grubb, M. J. and N. I. Meyer. 1993. Wind Energy: Resources, Systems, and Regional Strategies. Renewable Energy: Sources for Fuels and Electricity. Washington, D.C., Island Press. T. B. Johansson, H. Kelly, A. K. N. Reddy and R. Williams, ed., 157-212.
Lynette, R. and P. Gipe. 1994. Commercial Wind Turbines and Applications. Wind Turbine Technology: Fundamental Concepts of Wind Turbine Engineering. New York, ASME Press. D. A. Spera, ed., 139-214.
Mulugeta, Yacob & Drake, Frances. 1996. Assessment of solar and wind energy resources in Ethiopia. II: Wind energy, Solar Energy, Vol. 57, No. 4, pp. 323-334, 1996.
Pallabazzer, Rodolfo, and Gabow, Abdulkadir A. 1991. "Wind Resources of Somalia." Solar Energy Vol. 46, No. 5: 313-322.
Radwan, A. 1987. "Wind Energy in Saudi Arabia." In: Alternative Energy Sources VII, vol. 3.
Rosen, K. 1998. "Wind Power in Eritrea" San Jose State University Master's Thesis Project.
VanBuskirk, R., Garbesi K. and Rosen, K. 1997. "Wind Resource Assessment of Eritrea, Africa: Preliminary Results and Status." 1997 Italian Wind Energy Conference.
VanBuskirk, R.,. Personal communication, May 12,1998.
United States Naval Oceanography Command Detachment (1993). U.S. Navy regional climatic study of the Red Sea and adjacent waters, National Oceanic and Atmospheric Administration, Asheville, North Carolina.
United States Air Force Environmental Technical Application Center, Climatic Database Users Handbook No. 4, DATSAV2 Surface (Unclassified), December 1986, USAFETAC/UH-86/004