A preliminary analysis of daily rainfall statistics for Eritrea is presented. After decomposing the general probability function for rainfall amount into a probability of non-zero rain and a probability density function for the rainfall amount, the component probability functions are partially characterized. The probability density function for rainfall amount and the exceedance probability function for rainfall amount can be approximated as the sum of exponential functions. Such an approximation has three parameters that vary from month to month, but have fairly moderate variation by location. The variation of the function parameters are indicative of the seasonal regional changes in average daily intensity of rainfall.
A preliminary analysis of number of rain days per month is presented. It is found that a significant portion of the fluctuations of the number of rain days per month are due to year-to-year fluctuations in the monthly average probability of days with rain. There exists a distinct relationship between the fluctuation of the number of rain days per month and the average number of rain days per month, and a tentative explanation is provided.
A classification of rainfall climate subregions is provided and brief descriptions of the subregions and their distinct seasonal rainfall patterns are provided as a first step in the more detailed description of rainfall variation.
One of the most severe and important constraints on Eritrea's development and agricultural productin is the availability of water resources, either in the form of direct rainfall, surface water flow, or groundwater resources. If planning of water resources development is to be successful, improved estimates of probably rainfall and its characteristics and timeing is crucial. the goal of this study is to proivde a more detailed quantitative specification of the long-term characterisitcs of precipitation in Eritrea. Due to the difficulties incherent in rainfall prediction, the description that we develop is probabalistic or statistical. Such a probabalistic description of rainfall when combined with hydrologic or agricultural models can be used by natural resources planners, hydrologiest, agriculturalists, and climatologiest to improve estimates of surface and groundwater resources, crop failure risk, sediment yields, and expected benefits of agricultural development projects.
this study is organized at the University of Asmara, Eritrea, and began in its planning stages in October of 1993. At this time, contacts were made with the Water Resources Department, Land comission, and Civil Aviation Department of the Eritrean government. In February, computer equipment arrived, a team of research assistants were hired, and work began. This is a provisional report which details the priliminary findings of the first phase of the study. The results contained herein are PROVISIONAL. They should NOT be used at this stage for project planning studies without direct consultation of the study authoris. They outline a working hypothesis for a statistical model of Eritrean rainfall. This working hypothesis will undergo verification under phase II of the study to be conducted during the 1994-95 academic year. The third phase of the study to be undertaken in 1995-96 will be an applications phase. This phase will develop procedures for using the statistical model for hydrological, agricultural and natural resource calculations.
In the previous century, numerous climatological studies have been done in Eritrea. While a more extensive listing is provided in the bibliography, some of the more important or recent studies are described here. Furthermore, we discuss some of the data that has been collected and some of the data collection efforts underway.
From the Italian colonical era there are numberous climatological studies, examining the sutability of settlement, and agriculture. there are a wide variety of agricultural reports examing the feasibility of the cultivation of coffee, cotton, bananas, and other crops. Most of these reports contain some climate data, usually monthly summaries or average monthly rainfall, temperature, or other climatic variables. Furthemore, monthly data summaries were regularly published in the Bolleino Agricolo e Comerciale Della Eritrea. The publication of this bulletin was supervised by Prof. Isaia Baldrati who was involved with climate and hydrologic data collection in the period before World War I. A 1938 report by Prof. Filipo Eredia (Eredia, 1938) lists 34 stations for which some precipitation existed at that time, while a later report by Fantoli (Fantoli, 1966) list approximately 61 stations for which precipitation data was collected prior to 1953. Of these 61 stations, monthly rainfall totals are provided for 45 of these stations, while for the others, average monthly rainfall (averaged over several years) is provided. the Fantoli report is the most comprehensive of the historical Italian documents providing either average monthly rain or monthlyu rainfall totals for the stations indicated. It also provides other data such as the number of days with rain per month.
Also an isohyetal map for averal annual rainfall is provide in the Fantoli report. This map has some stark inaccuracies in it and in general over-estimates rainfall in Eritrea. Some of the inaccuracies include an indication that the annual rainfall of Nacfa is greater than 500 mm, that of ghinda is greater than 1000 mm (even though Fantoli's data indicates an annual average of 746 mm), and that there is a zone of more than 1000 mm of rain between Adi Quala and Adua (even though Fantoli's data indicates an annual average for Adi Quala of 698 mm). some of these inaccuracies may be because the period of record of most stations seems to be concentrated in a consistently wet period of Eritrea's history, while other erros may be the result of the author attempting to make the highly erratic spacial pattern of Eritrea's rainfall conform to a map with smooth variations that conform to the country's topography.
Though there are a variety of sources that provide some monthly summaries of rainfall amounts during the Italian era, much of the daily data that was collected is largely unavailable in Eritrea at present. Furthemore, some of the daily data that is unavailable actually exists in old records that have yet to be thoroughly examined. The Research and Documentation Center is currently compiling and cataloguing colonial documents which contain significant protions of the missing data. There are indications that some of the specific meteorological reocords of te Italian Colonital era may be accessible in the State Archives in rome. A listing of the contents of the Eritrea Archives in Rome (Servisio Storico e Documentazione, 1977) indicates that these archives contain the meteorological records from at least 1903, 1905, 1906, 1925, 1926, and 1927. It is hoped that some of these records will contain daily data and data from both the listed and previous years. These records will be examined by EICAP researchers in September 1994.
Data for relatively few stations is available from the era of Ethiopian administration (or domination) of Eritrea. The number of stations for which daily precipitations data is currently available at the Civil Aviation Department numbers only 17. Of these 17 stations (Adi Kaieh, Adi Quala, Adi Ugri, Afeabet, Agordat, Assab, Arentur, Delle, Ebaro, Elabared, Ghinda, Keren, Massawa, Nakfa, Nefasit, Senafe, Tessenei), seven (Adi Quala, Afeabet, Barentu, Delle, Ebaro, Nefasit, Senafe) have less than five years of data. It is said that during the Ethiopian withdrawal, all original copies of the meteorological data were taken to Ethiopia, with only that data which was copied remaining in the country. There may be efforts to obtain copies of some of this lost data from a variety of sources. Current cooperation agreements between Ethiopia and Eritrea may yield copies of much missing daily data. A catalogue of available monthly data from Civil Aviation Deparmtent is being compiled. The existence of monthly and annual rainfall data during periods where there is no daily data available in Eritrea indicates that there may exist copies of daily data in Ethiopia or Italy that have not yet been provided to the Eritrean government. A partial listing of the stations and periods for which annual data is available but daily data is not is provided in the following Table 1.
| STATION | DAILY DATA AVAIL. | ANNUAL DATA AVAIL. (but not daily data) |
| Adi Teclesan | None | 1949-62 |
| Adi Kaieh | 1942-45,47-59,65-67,73-76,82 | 1923-41,60-64,68-69,77 |
| Adi Quala | 1965-67,72-73 | 1932-39,42-57 |
| Adi Ugri | 1932-36,41-66,74-76 | no annual w/o daily |
| Afeabet | 1965-67 | 1967-70 |
| Agordat | 1940-78 | 1922-39 |
| Asmara City | None | 1949-55,67-70 |
| Asmara Airport | ||
| Assab | 1947-80,82-91 | 1931,33,37-39,45 |
| Belesa | None | 1924-26,37-65,72-74 |
| Decamhare | None | 1931-40,42-62,65-67 |
| Durfo | None | 1923,30-55 |
| Ebaro | 1965-68 | no annual w/o daily |
| Faghena | None | 1927-40,50-62 |
| Fil-File | None | 1928-62 |
| Gheleb | None | 1927-39,42-53 |
| Ghinda | 1946-64,66 | 1919-20,23-28,30-34,38-40,42-43,45 |
| Keren | 1958-65,67 | 1919--40,71-72,74 |
| Massawa | 1947-77,82-89 | 1885-1907,1912-15,26-46,78-81 |
| Nacfa | 1942-45,47-68 | 1905-07,12-26,28-41 |
| Nefasit | 1967-68 | 1933-36,38-40,42-48 |
| Senafe | 1965-68 | 1933-36,38-40,42-62,69,71-74 |
| Tekombia | None | 1958-62 |
| Tessenei | 1947-48,50-65,67-72 | 1926-40,42,44,46 |
Note that in the above table, if any monthly annual or daily data is available, the respective year is listed. there are many other stations for which monthly or annual data is available but for which there is no daily data available in Eritrea as of yet.
There were also various studies published during this time and several atlases which showed isohyetal maps for Ethiopia. but most of these studies considered Eritrea as part of Ethiopia, and were performed on a large scale on which the intricacies of Eritrean climate variations were lost.
While no comprehensive study exists, there do exist various efforts to compile and report average monthly rainfall, and to provide some revised isohyetal maps. the most comprehensive attempt to compile monthly average rainfal to date is the compilation by Paolo Nastasi included in his Notes Concerning Climatic and Floristic Regions of Eritrea (Nastasi, 1993). This proivdes average monthly rainfall for 26 stations using data from both the Fantoli report (Fantoli, 1966), and data from the Civil Aviation Department.
In addition to compilations of historical data, active programs to collect new data are underway. The Water Resources Department has established numerous class III climatic stations where daily readings of maximum and minimum temperature along with daily rainfall are taken. These stations were initiated in May and June 1993 and generally, a little less than one year of daily precipitation data is available. for several stations, a reliable data collection system has not yet been worked out, and the data is still incomplete. Improvements should probably be made in at least the rainfall measurements of these stations. Currently rainfall is recorded by means of a graduated plastic receptacle mounted on a plastic stake and does not ahve a large funnel. The receptacle has graduations only to 30mm, and would probably begin overflowing (or splashing) with 50 mm of precipitation. Furthermore, hail would easily bounce out of the receptacle. In addition, if there is a delay in reading the rainfall then rainfall measurements may be diminished due to evaporation which may range from 3mm to 10mm per day. Several stations have also been established by the Department of Agriculture. Again the data collection is in its incipient stations and the data is not yet published.
The Water Resources Department is implementing a network of first class automated stations at Carcabet, Dahlak, Fil-Fil, Homib, Om Hager, She'eb, Shambuku, Thio, and Tzoren. Meanwhile, the Civil Aviation Department with assistance from EGADD plans at establishing first class stations at the major airstrips in Adi Kaieh, Adi Quala, Agordat, Aligadier, Barentu, Keren, Massawa, Mendefera, and Nacfa. With the combination of current efforts and the plans to install high-quality environmental data monitoring stations, a fairly comprehensive network will be coming into place. This will provide an excellent network of first class meteorological stations, but it may be several years before many conclusions can be drawn from this data without careful analysis.
Eritrea's climate is classically divided into three zones or climate types: 1) the Eastern Escarpment and Lowlands, 2) the Central Plateau or Highlands, and 3) the Western Lowlands. The standard description then goes on to describe the Eastern Escarpment as dominated by winter rains, hot temperatures, greater humidity, and greater cloud cover, while the Highlands have mild temperatures, small rains of March to May, and a large summer-time or `Keremti' rain of July and August, while finally the Western Lowlands are characterized by one set of summer monsoon rains that are concentrated in July to September and hot temperatures.
The climatic mechanisms attributed to these regions are as follows [Lan72]: the summer rains are attributed to the migration of the Intertropical Convergence Zone [I.T.C.Z.] to the north of Eritrea, and the resulting convergence produces generalized rains in the area, which retreat with the I.T.C.Z. when it moves south in September. The small rains period (March-May) is produced by the weakening of the Arabian high pressure zone as it moves south to the Indian Ocean. This induces warm, moist air to flow from the south, which combined with cold upper-level westerlies is conducive to thunderstorm activity. For the winter rains, it is asserted that there is a convergence of two air masses, the Indian Ocean easterlies, and the Atlantic westerlies, with resultant ascent and precipitation.
In this report, we wish to make a greater range of climatic distinctions in order to highlight the variability of climatic parameters and rainfall mechanisms. Therefore, we divide Eritrea into 11 climatic subregions or subzones which are described below and illustrated in Map A.
The Northwestern Lowlands (NWL) region is a relatively dry and hot region. Its rainfall distribution can be affected greatly by orographic enhancement. The vast majority of rain arrives with the I.T.C.Z. in June to September, with the northern extreme of this area receiving very little rainfall. Average annual precipitation in this region probably ranges from 100 mm to nearly 400 mm.
The Southwestern Plains and Hills (SWL), experience only summer rains due to the I.T.C.Z., with possibly some enhancement of these rains with increasing elevation and increasing trend of rainfall to the south. But the Keremti rains remain in this subregion longer than in other parts of Eritrea, with June and September as very significant rainfall months. Otherwise, this subregion is hot and dry for the rest of the year. Average annual rainfall may vary from 300mm - 600mm.
The Southwestern Escarpment (SWE) is a region of transition between the southwestern plains and the central highlands. Important questions include: what effects the steep slopes and mountains of this region have in orographic enhancement and production of rain-shadows? To date, data for this subregion is almost entirely lacking. Average annual rainfall in this region varies from less than 400mm to over 700mm.
The Central Highlands (CHS and CHN) have the greatest density of rainfall stations. Important questions for this region include the geographical extent of the `little rains' of March to May, the potential bias produced in previous isohyetal maps by the overabundance of high-elevation stations and dearth of lower-elevation stations. Also for this region, some fairly detailed study of drought risk, rainfall variability, rainfall intensity, and spacial correlation of rainfall events can be performed. Average annual rainfall varies from 400mm to possibly over 700mm in this region.
The South Eastern Escarpment (SEE) is a generally dry region of the country with very few rainfall stations. The details of the climatic transition between the semi-arid central highlands to the extremely arid Danakil Depression need to be investigated. In this region, average annual rainfall varies from less than 100mm at low altitudes to over 500mm at the mountain tops.`
The Central Eastern Escarpment (CEE) is the wettest region of Eritrea where there are localized orographic effects that produce average annual precipitations reaching 1000 mm.
The North Eastern Escarpment (NEE) may receive significant winter rains but in amounts much smaller than those of the central eastern escarpment. And important question is how the winter rains are enhanced along the escarpment, and how they diminish or are enhanced as one progresses north. Average annual rainfall probably varies from 100mm to about 400mm.
The Northern Highlands (NH) receive occasional rains from frontal systems descending from the North, receive a highly irregular amount of rain from the summer monsoon, and have a plethora of orographic enhancement and rain-shadow effects that need to be estimated. A drought frequency and risk evaluation is very important for this region. Average annual rainfall in this region probably varies from less than 100mm to more than 500mm.
The North Eastern Lowlands (NEL) has very low rainfall, high temperatures and high humidity. For many areas there may be a regular afternoon sea breeze. Average annual rainfall in this region is generally less than 200mm.
The South Eastern Lowlands (SEL) is an extremely arid region of the country with very low precipitation amounts, a sparsity of stations, and extremely hot temperatures. In this region average annual rainfall is probably everywhere less than 150mm.
The types of statistical analysis that can be performed depends largely on the type of data that is available and its quantity. In the case of Eritrea, we can put data and rainfall stations into several different categories: 1) Daily Baseline Stations for which long-term, daily data exist, 2) Monthly Baseline Stations for which long-term monthly rainfall totals and number of rainy days per month exists, 3) Extrapolated Stations for which short to medium term monthly data exists, and 4) Short-term Daily Stations for which short term daily data exists. Our current list of these stations is as follows:
The different types of data and stations will be useful for answering different questions. Of course the Daily Baseline Stations will be most useful for characterizing the Eritrean climate. Then the role of the other stations will be to extrapolate these results to other locations in Eritrea.
There are a variety of questions we can pose regarding precipitation in Eritrea, in this sections we describe some of these questions:
What is the probability distribution for daily rainfall amount? Does the probability function vary with location (are rainfalls more intense in Agordat or Asmara?) and what are the 10, 50 and 100 year extreme rainfalls. Are there statistically significant variations of average daily rainfall from month to month or station to station? These questions will be posed to the Daily Baseline Stations.
Other questions concern the annual rainfall statistics. What are the patterns of dry and wet years?, Is the intensity of the spring, monsoon, and winter rains de-correlated? If so, then what are the annual rainfall variations for the three separate rain types? What are the respective dry and wet periods? Are the Wet and dry periods the same for the different stations?
In this report, we provide partial answers to the first group of questions by analyzing the rainfall statistics of the Daily Baseline Stations. Fits have been made to the frequency distribution of daily rainfall and a rough sensitivity analysis has been performed. In phase II of the study chi-squared evaluations of model distributions will be performed and confidence intervals will be calculated. The fits for different stations will be compared for significant differences. Also for the Monthly Baseline Stations, we will comprehensively plot the cumulative deviation from mean values for the winter, spring, and summer monsoon rain totals for the different stations. This should graphically indicate correlations or de-correlation of drought between stations for the different rain types. Correlations or de-correlation will be confirmed through calculation of the correlation coefficients. As part of phase II of this study, a detailed correlation analysis of daily rainfall amounts will be performed.
With regards to correlations between stations, for all daily rainfall stations, the correlation of rainy days and rainfall amounts will be examined. Even for very short-terms records, meaningful results might be obtained. The dependence of correlation coefficients on distance will also be examined.
For monthly stations, correlations of the number of rainy days, and monthly rainfall totals will be compared. Most of this work will be performed in the 1994-5 phase II component of this study. Here we present only a brief description of very preliminary results and hypotheses.
After verification of the statistical model in phase II of the study, by using the correlations and the probability functions obtained in the other analyses, average monthly rainfall totals with 95% confidence intervals will be calculated for all stations for which meaningful results can be obtained.
Again in phase II of the study, by using satellite photographs at the Civil Aviation Department correlations between cloud cover and rainy days will be examined for Daily Rainfall stations which are currently in operation. The results will be used to extrapolate the Average Monthly Rainfall to portions of the country where no rainfall data exists.
Because of the highly variable and effectively random nature of rainfall, a probabalistic or statistical description of rainfall amounts and distributions is often most appropriate. Hence in this report we describe some of the statistics of rainfall data and provide a description of a statistical rainfall model.
Generally speaking, within a certain time interval from time t to t+dt, there is a certain probability that it will rain an amount between R millimeters and R + dR millimeters, at a particular location (x,y). When can characterize this probability by a probability density function:
where t is the time, dt is the time interval (in our case this will always be one day), x and y are the longitude and latitude of the location, R is the rainfall amount, and dR is the differential rainfall interval.
In this report we will drop the dt and always consider it to be one day unless otherwise specified. Secondly, we will sometimes replace the position coordinates (x,y) by the name of the station or location.
Next if we define PR>0(x,y,t) as the probability that it will rain on a given day at a given location, then we can decompose our probability function as follows:
where PR=0 = 1 - PR>0 = the probability that it will not rain at all on day t, and location x,y. Meanwhile pR is the probability density function for a given rainfall amount for those days with rain. It represents the probability of getting a rainfall amount between R and R+dR on those days that it does rain. The purpose of this decomposition is to separate those portions of the rainfall statistics which may have large spacial variations (but which may be easy to measure) from that portion of the statistics which may depend more on cloud physics and the properties of regional weather systems. Note that at this stage, we have provided only a formal decomposition of the probability function describing rainfall and have made no specific assumptions about these functions. In the following sections we will empirically examine the rainfall statistics and the spacial and temporal behavior of these functions.
The daily rainfall for several stations is examined. The first question posed is what are the probability distributions for daily rainfall amounts for days with rain. The distribution in which we are interested is that which gives the probability of a given a amount of rain on days on which rain is observed. We call this function pR(x,y,t,R), where pR is the probability density (in units of mm-1) and R is the daily rainfall amount in units of millimeters (mm). In general this function is depends on location and the particular month or year. For simplicity, in the following discussion, we will suppress the spacial and temporal dependence of this function. In the rest of this section, we will temporarily drop the subscript R.
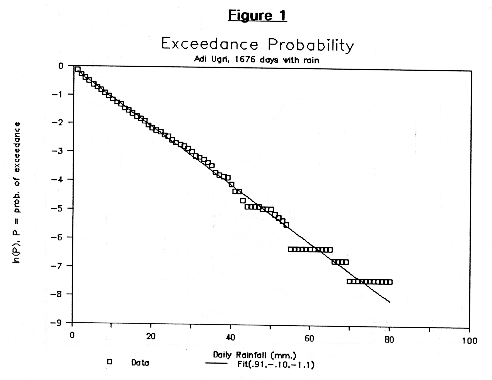
Note that p(R)*dR is the probability that on a day with rain, the rainfall amount will be between p(R)-½dR and p(R)+½dR. In order to calculate this rainfall distribution we will examine an integral of the distribution (from R to ¥) which we call the Exceedance Probability, or Probability of Exceedance, px(R). The exceedance probability px(R) is the probability that on any given day with rain, the daily rainfall amount will exceed a total of R millimeters. Once one has a functional form for the exceedance probability, the regular probability function is simply the negative derivative of the exceedance probability: p(R) = -dpx/dR:
To calculate the probability distribution function p(R), the daily rainfall data are first calculated by sorting the daily rainfall data into bins of 1 mm size. After this sorting, we had for each rainfall amount R (rounded to 1mm), the number of rainy days, N(R) that had a rainfall of between R and R - 1mm. To calculate the probability function we calculate N(R)/NT, where NT is the total number of days with rain.
To calculate the exceedance probability from the data, for each value of R, we sum the total number of days of rain with rainfalls greater than R. Then we divide this number by NT, the total number of days with rain.
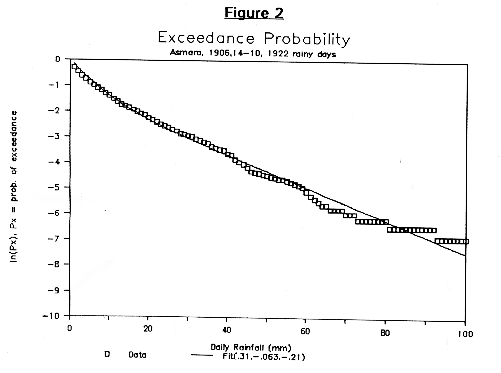
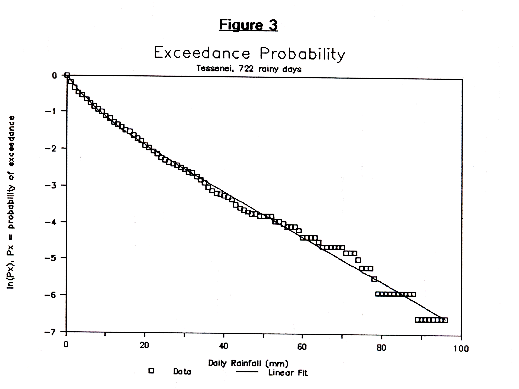
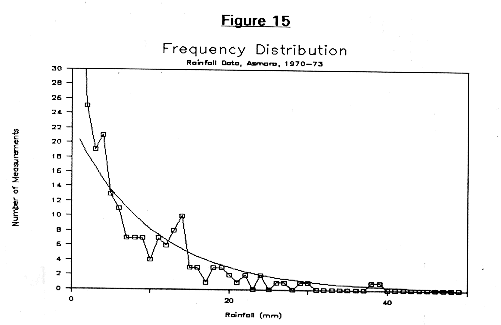
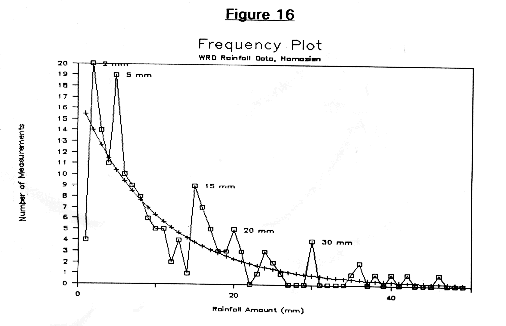
Figures 1 through 3 show the exceedance probability distributions for three stations: Adi Ugri, Asmara (1906, 1914-40), and Tessenei on a semi-log plot where the vertical axis is the natural log of the exceedance probability, px, and the horizontal axis is the daily rainfall amount.
We find that the resulting plot is fit moderately well, with an exponential function, and is fit very well with a function that is the sum of two exponentials. This can be written in the form:
In each of the figures, the data points are represented by the squares or diamonds, while the fit curve is shown as a curve. For the sake of convention we will take |a| < |ß|. Generally we calculate A and a by a linear least squares fit of ln(px(R)). Meanwhile ß is chosen such that the root mean square deviation of the fit with the data is minimized. The following table summarizes the values obtained to date.
Note that the values of these parameters, though not identical, are similar for all stations, with the greatest deviation shown by Adi Ugri and Adi Kaieh. For all other stations A ranges from 0.3 to 0.65, a varies from 0.60 to 0.70, and ß varies from 0.16 to 0.32. It is conceivable that the Adi Ugri and Adi Kaieh have slightly different distributions because of the relatively large proportion of spring rains (March, April, and May) which tend to produce lighter rain showers. One potential explanation for the similarly of these values for the other stations is that the physical weather-producing mechanisms are similar throughout the country and produce distributions of rainfall that have the same proportions of heavy, medium and light rains.
TABLE 2: Average Annual Parameter Values for Exceedance Probability Function| Station | A | a | b |
| Adi Kaieh, 1942-59,65-7,74-5 | 0.64 | 0.089 | 0.56 |
| Adi Ugri, 1932-5,41-66,75-6 | 0.91 | 0.100 | 1.10 |
| Agordat, 1933-77 | 0.35 | 0.065 | 0.16 |
| Asmara, 1906, 1914-40 | 0.31 | 0.063 | 0.21 |
| Asmara, 1943-90 | 0.37 | 0.060 | 0.20 |
| Ghinda, 1947-66 | 0.64 | 0.070 | 0.32 |
| Tessenei, 1947-73 | 0.50 | 0.061 | 0.22 |
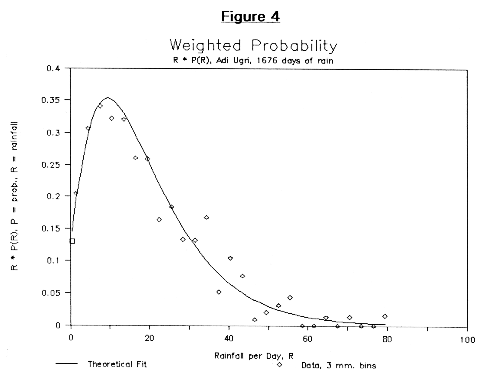
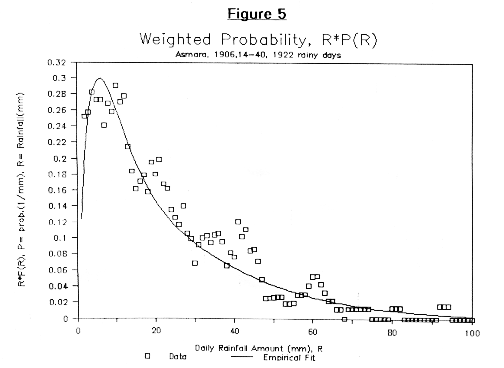
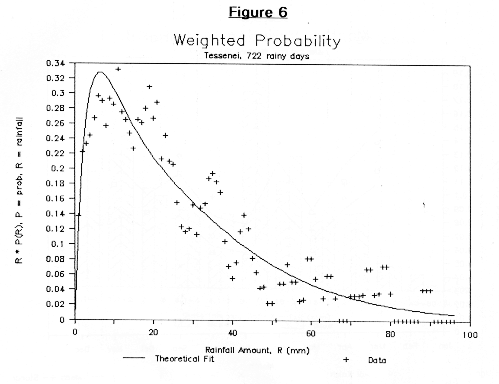
A further test of the functional fit to the exceedance probability is to compare its transformations to the corresponding representations of the daily rainfall data. Figures 4 through 6 do this by comparing the theoretical prediction of the weighted probability density, R * p(R), with the corresponding calculation from the data. The data is calculated by multiplying by R the probability distribution function of the data which is calculated as described above. In order to moderate the statistical fluctuations, the value of the weighted probability function for the data is taken as the average of the value at R-1mm, R, and R+1mm. The theoretical function is given by:
by differentiating the fitted function and multiplying by R. Note that the integral of the weighted probability is the average rainfall measured on a day with rain.
A semi-physical explanation for the calculated probability distributions can be formulated in terms of the probability of unit rainfall events. Suppose that there are two types of rainfall events, or weather systems that produce rain in Eritrea and on any particular day one or the other is operative, but not both. Then for the sake of example, let us say that 65% of the days, a nimbostratus-type rainfall system that has a probability U of producing a 1 mm. rainfall occurs. Meanwhile the second type is a cumulonimbus-type rain that has a probability V of producing a rainfall of 1 mm. Then the probability of producing a rainfall R on any given day is of the form B*UR + C*VR. This can be rewritten p(R) = B*eln(U)*R + C*eln(V)*R. This is equivalent to the equation for p(R) described above if B = a*A, ln(U) = -a, C = ß*(1-A), and ln(V) = -ß.
In general the probability distribution functions can vary with time. Therefore, we examined how these functions (or the parameters of the functional fit) varied month-by-month for the various stations. It is found that there is a distinct, but gradual seasonal variation of the parameters of the probability distribution function. During the rainiest months, a is approximately 0.06 - 0.08 mm-1, while during the gentler rains (March, April, June, Oct, and November for the stations West of the Eastern Escarpment) it is ranges from 0.09 to 0.014. May tends to have a small fraction of higher intensity rainshowers that give it an average value of a, of 0.06 or 0.07. For Ghinda, large daily rainfall totals are more likely almost throughout the year, with small values of a < 0.07 for five of the eight months which have more than 85 total days with rain on record. The table below represents the rough average values of the parameters obtained for the different stations. Unless otherwise specified, we hypothesize that it is appropriate to use the average regional parameters. Important exceptions, include the differences between Eastern Escarpment stations (such as Ghinda) and those stations West of the Escarpment. It may be appropriate to simply change the value of the primary exponent a. Other important exceptions include the differences between Asmara, Agordat, and Tessenei, and Adi Ugri and Adi Kaieh. It appears that the exponents for July and August for the latter pair of stations are significantly lower. Another possible exception is Tessenei in September, where the lingering Keremti rains may maintain high-intensity rainfalls that result in a low value for a.
TABLE 3: Approximate Monthly Variation of Exceedance Probablity Parameters| Parameter | Jan | Feb | Mar | Apr | May | Jun | Jul | Aug | Sep | Oct | Nov | Dec |
| a (main) a (AdUg) a (Tess) a (Ghnda) |
(0.15) (0.15) (0.15) 0.10 |
(0.15) (0.15) (0.15) 0.08 |
0.13 0.13 0.13 0.05 |
0.11 0.11 0.11 0.09 |
0.08 0.08 0.08 0.05 |
0.11 0.11 0.11 0.06 |
0.065 0.08 0.06 0.06 |
0.065 0.08 0.06 0.06 |
0.12 0.12 0.06 0.06 |
0.09 0.09 0.09 0.06 |
0.10 0.10 0.10 0.07 |
0.2 0.2 0.2 0.07 |
| A | 0.9 | 0.65 | 0.5 | 0.65 | 0.55 | 0.70 | 0.70 | 0.70 | 0.7 | 0.7 | 0.7 | 0.8 |
| b | (3.) | (0.8) | 0.9 | 0.6 | 0.35 | 0.5 | 0.40 | 0.30 | 0.70 | 0.5 | 1. | 1. |
Note that these values of the statistical parameters were obtained using daily data from Asmara (2844 days), Adi Ugri (1676 days), Adi Kaieh (1455 days), Agordat (1536 days), Ghinda (1299 days), and Tessenei (720 days), where the numbers in parenthesis are the number of days with rain.
We performed a rough sensitivity analysis of our values of a as follows. For those months with 100 or more data points, we removed the two largest rainfall events and recalculated the exponent. Typically these rainfall were approximately 80 mm, which had a probability of daily occurrence of 0.005. The probability of occurrence of one event of 80 mm or more in a sample of 100 data points was typically 40%, with a 60% chance that no such event would occur. Therefore, one would expect a substantial fluctuation in the number of large events. We found that when the two largest such events were removed that the value of a would decrease by an amount of approximately 0.01 to 0.03 mm-1. A more theoretical sensitivity analysis is presented in an appendix. Using a simplified procedure for determining the value of the exponent, it is found that for that simplified procedure, the standard deviation of the result should be 15% to 30% of the value obtained.
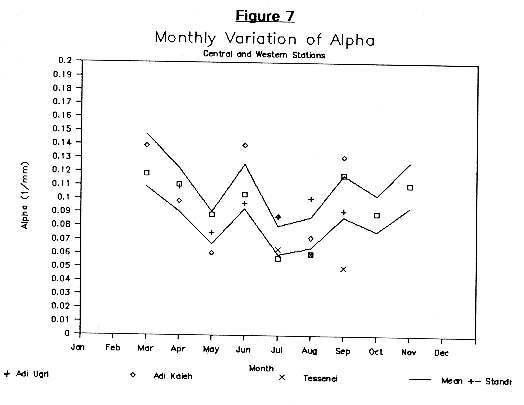
Figure 7 illustrates the monthly variation of a for stations West of the Eastern Escarpment. The symbols represent the values calculated from the daily data aggregated by month. The results are indicated only if there are at least 100 days with rain. The two curves represent our estimate of the plus and minus one standard deviation from the mean value based on our sensitivity analysis. The month-by-month mean values are as follows indicated by the top values in the previous table.
For an initial working hypothesis (which will need to be subject to testing), we shall propose that the values represented in the table above provide rough monthly characterization of the probability density pR(M,R), where M is the month and R is the rainfall amount. The prescription for calculating the probability density for a given rainfall amount is to read the parameters from the above table and use the equation:
Note also that the average daily rainfall amount can also be written as a function of the parameters of the distribution: Rav = (A/a) + ((1-A)/ß). The table above provides only very approximate values of these parameters. A more precise prescription for determining the parameters might be to formulate a monthly average daily rainfall maps, assume that either A and ß, or a and ß do not vary with location (but vary month to month) , and then use the average daily rainfall to determine either a or A. This may be a desirable procedure, especially when the measurement of small (less than one mm) rainfall amounts is unreliable, since this can have a significant effect on A (since as many as 25% of rainfalls may be less than 1 mm).
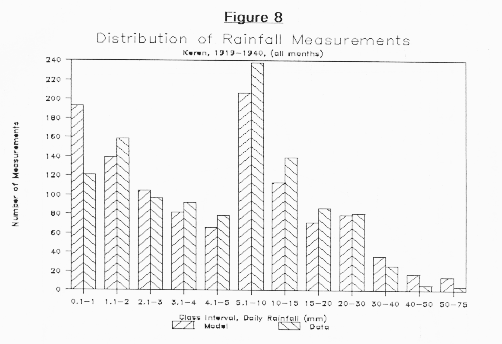
Figure 8 provides a rough preliminary test of the working hypothesis by comparing the model distribution of different rainfall amounts for Keren with the statistics provided in Fantoli [Fan66]. The histogram shows reasonable agreement, but there are probably significant discrepancies in the prediction of the number of small and very large rainfall amounts. Some of this is because the probability distributions are derived from several high-altitude stations which may tend to have more small rainfall events (since for low-elevation low-humidity stations small rainfalls may evaporate before being measured or before striking the ground). The model distribution also provides high estimates for some of the larger rainfall events. Over the course of the next year, a more careful evaluation of the model probability distributions is planned. The result of this more careful evaluation may not only be slight changes in parameter values, but also a map of the variation of these parameters with location.
As described in a previous section, any statistical description of rainfall in Eritrea can be decomposed into two components: 1) The probability that it will rain on any given day, and 2) the probability that if it rains, it will rain a given amount. In the previous section we described the probability distributions for the amount of rainfall (for days with rain). We found that this function has relatively small variations with location, but larger seasonal (month-to-month) variations. The probability of rain on any given day, on the other hand has large variations with location. For example, according to data from Fantoli [Fan66], the average number of rainy days per month for July can vary from 8 days for Valle Dorfu, to 11.4 days for Lake Beleza, to 17.8 days for Asmara, to 21 days for Adi Ugri and Adi Quala. This is a variation of a factor of more than 2.5 in less than 60 kilometers, with a large portion of the variation occurring over just a few kilometers. This large variation also occurs within the same climatic region of Eritrea.
It is important to not only describe the average number of rainy days per month but to describe and explain the year to year variations in the number of rainy days per month. There are at least two reasons for these variations: 1) random fluctuations, and 2) annual (year to year) fluctuations in the physical or meteorological mechanisms that produce rain.
Note that even if the general characteristics rainfall in Eritrea were the same every year, there would still be statistical fluctuations in the number of days with rain. For example, suppose that every July in Asmara during every year, there is a 55% chance of rain for every day of the month. This probability corresponds to an average of 17 days with rain in July. But even though the probability is constant, there still is some probability that there will be only 15 days of rain in July, or 20 days of rain in July. The probability of different numbers of rainy days in July can be calculated mathematically in this case (this is done in `Appendix B: Probability of J occurrences of N events').
Our results show that a significant portion of the fluctuations of the number of rainy days per month are statistical, but that one cannot explain all of the fluctuations of the number of rainy days per month by assuming a constant probability. As we might expect, there must be some fluctuation from year to year of the average likelihood of rainy day during a given month. This corresponds to year-to-year changes in the weather over Eritrea which either decrease or increase the average likelihood of rain on any given day in any given month. In this section we calculate these fluctuations in the probability of a rainy day, and describe the variations and correlations of these probabilities.
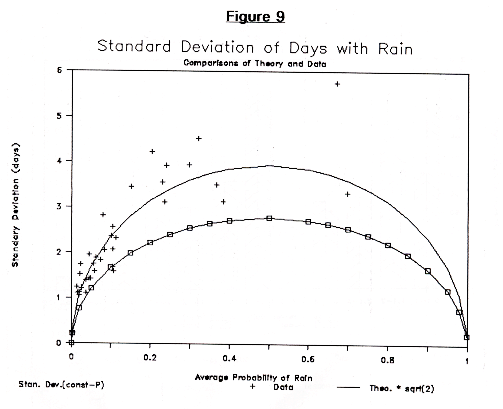
We have made a preliminary comparison between the observed fluctuations from year to year of the number of rainy days per month with the predictions of the constant rainfall probability case. Figure 9 illustrates this comparison by plotting the standard deviation of the number of rainy days per month as a function of the average probability of rain for that month. We plot both the constant probability model and results from some of the available data. The lower curve is the standard deviation of fluctuations of the constant probability model for fluctuations in the number of rainy days per month, while the crosses are the observed standard deviations from three stations. The upper curve is approximately 1.4 times the lower curve. Indicating that the observed data seems to have a year to year fluctuation in the rainfall probability, which for probabilities between 0.2 and 0.7 has a standard deviation of about 0.1.
We can develop a relatively simple explanation or model for these extra fluctuations in the number of rainy days per month which are proportional to the constant probability case. Suppose that the probability of rain on any given day is equal to a constant plus a terms which indicate a fractional dependence on the rainfall on previous days as follows:
where P is the probability of rain on day d, Pav is the average probability of rain for the month averaged over many years, C is a constant and E(d) is 1 if it rained on the previous day d and 0 if it did not. Note that Pav = [S E(d)]/(NmNy) where Nm is the number of days in the month and Ny is the number of years over which the sum is taken. Also, S represents the summation over all days for that month over all of the years of available data. The question is that if we define a yearly average probability, what is the standard deviation of its fluctuations, Sm. Now let's estimate the average fluctuations for one month: Sm = (C+C²+C3+...) * Se = K * Se, yet Se² = Sm² + S0², by the rules of a combination of standard deviations. Therefore solving for Se, we find that Se² = S0²/(1-K²). To match the observed result, we must have that 1-K²= 1/(1.4)², which implies that K " 1/Ö2, and that C " 0.4. Such a model implies an auto-correlation that tends to produce wet and dry periods of a few days. We will at a later time test this model by examining the extent of autocorrelation shown in the rainfall data.
These numbers are provisional values which may consistently over-estimate many of the probabilities by 10% to 25%.
| Jan | Feb | Mar | Apr | May | Jun | Jul | Aug | Sep | Oct | Nov | Dec | |
| Northwestern Lowlands | ||||||||||||
| Keren | 0.00 | 0.00 | 0.02 | 0.08 | 0.13 | 0.29 | 0.42 | 0.53 | 0.23 | 0.02 | 0.02 | 0.00 |
| Agordat | 0.00 | 0.00 | 0.00 | 0.02 | 0.05 | 0.09 | 0.29 | 0.34 | 0.16 | 0.02 | 0.00 | 0.00 |
| Sabderat | 0.00 | 0.00 | 0.00 | 0.01 | 0.05 | 0.08 | 0.17 | 0.24 | 0.16 | 0.02 | 0.00 | 0.00 |
| Southwestern Plains and Hills | ||||||||||||
| Om Hager | 0.00 | 0.00 | 0.00 | 0.05 | 0.12 | 0.31 | 0.40 | 0.42 | 0.25 | 0.03 | 0.00 | 0.00 |
| Tessenei | 0.00 | 0.00 | 0.00 | 0.03 | 0.08 | 0.15 | 0.29 | 0.36 | 0.21 | 0.05 | 0.00 | 0.00 |
| Barentu | 0.00 | 0.00 | 0.01 | 0.05 | 0.10 | 0.23 | 0.36 | 0.40 | 0.21 | 0.05 | 0.01 | 0.00 |
| Cullucu | 0.00 | 0.00 | 0.02 | 0.08 | 0.11 | 0.31 | 0.47 | 0.47 | 0.26 | 0.05 | 0.04 | 0.00 |
| Augaro | 0.00 | 0.02 | 0.04 | 0.05 | 0.07 | 0.29 | 0.35 | 0.41 | 0.23 | 0.02 | 0.01 | 0.00 |
| Southwestern Escarpment No data available |
||||||||||||
| Central Highlands (South) | ||||||||||||
| Adi Quala | 0.00 | 0.01 | 0.04 | 0.13 | 0.14 | 0.24 | 0.68 | 0.67 | 0.24 | 0.03 | 0.05 | 0.00 |
| Adi Ugri | 0.01 | 0.02 | 0.08 | 0.20 | 0.23 | 0.34 | 0.67 | 0.71 | 0.24 | 0.07 | 0.08 | 0.02 |
| Chenafena | 0.00 | 0.00 | 0.05 | 0.14 | 0.15 | 0.33 | 0.58 | 0.58 | 0.22 | 0.08 | 0.01 | 0.00 |
| Senafe | 0.03 | 0.09 | 0.14 | 0.24 | 0.13 | 0.16 | 0.53 | 0.47 | 0.14 | 0.04 | 0.09 | 0.04 |
| Adi Kaieh | 0.05 | 0.06 | 0.13 | 0.23 | 0.15 | 0.16 | 0.51 | 0.41 | 0.09 | 0.04 | 0.08 | 0.07 |
| Decamere | 0.08 | 0.10 | 0.07 | 0.14 | 0.16 | 0.17 | 0.56 | 0.48 | 0.13 | 0.02 | 0.06 | 0.05 |
| Debaroa | 0.00 | 0.03 | 0.04 | 0.23 | 0.18 | 0.23 | 0.50 | 0.52 | 0.08 | 0.07 | 0.07 | 0.01 |
| Central Highlands (Nouth) | ||||||||||||
| Zazzega | 0.00 | 0.00 | 0.06 | 0.16 | 0.15 | 0.13 | 0.39 | 0.43 | 0.11 | 0.04 | 0.06 | 0.00 |
| Asmara | 0.03 | 0.04 | 0.06 | 0.19 | 0.20 | 0.17 | 0.57 | 0.55 | 0.19 | 0.08 | 0.09 | 0.00 |
| Beleza | 0.02 | 0.02 | 0.04 | 0.08 | 0.10 | 0.10 | 0.37 | 0.38 | 0.15 | 0.05 | 0.03 | 0.02 |
| Adi Teclezan | 0.01 | 0.01 | 0.02 | 0.10 | 0.12 | 0.19 | 0.47 | 0.56 | 0.16 | 0.03 | 0.05 | 0.01 |
| Southeastern Escarpment | ||||||||||||
| Nefasit | 0.21 | 0.17 | 0.08 | 0.12 | 0.08 | 0.09 | 0.52 | 0.32 | 0.15 | 0.13 | 0.09 | 0.15 |
| Centraleastern Escarpment | ||||||||||||
| Ghinda | 0.30 | 0.40 | 0.27 | 0.17 | 0.07 | 0.03 | 0.16 | 0.16 | 0.05 | 0.12 | 0.12 | 0.21 |
| Fil-Fil | 0.45 | 0.54 | 0.36 | 0.25 | 0.14 | 0.06 | 0.26 | 0.20 | 0.08 | 0.16 | 0.21 | 0.31 |
| Merara | 0.44 | 0.52 | 0.33 | 0.22 | 0.12 | 0.08 | 0.33 | 0.27 | 0.10 | 0.17 | 0.19 | 0.33 |
| Northeastern Escarpment | ||||||||||||
| Gheleb | 0.12 | 0.15 | 0.10 | 0.14 | 0.09 | 0.15 | 0.32 | 0.38 | 0.14 | 0.07 | 0.06 | 0.07 |
| Northern Mountains | ||||||||||||
| Nacfa | 0.04 | 0.04 | 0.05 | 0.10 | 0.11 | 0.10 | 0.23 | 0.30 | 0.11 | 0.06 | 0.05 | 0.02 |
| Northeastern Lowlands | ||||||||||||
| Massawa | 0.16 | 0.23 | 0.12 | 0.07 | 0.03 | 0.00 | 0.01 | 0.01 | 0.01 | 0.06 | 0.05 | 0.12 |
| Southeastern Lowlands | ||||||||||||
| Thio | 0.06 | 0.07 | 0.04 | 0.02 | 0.02 | 0.00 | 0.02 | 0.04 | 0.00 | 0.00 | 0.01 | 0.01 |
While annual variations and correlations of annual variations between stations will be analyzed in some detail in the future, currently only some preliminary plots that illustrate wet and dry periods in Eritrea's history have been made.
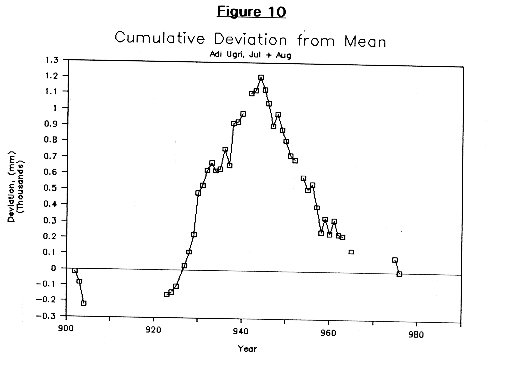
Figures 10 and 11 illustrate the cumulative deviation from the mean for the July and August rains of Adi Ugri, and the July, August and September rains of Tessenei. The cumulative deviation is calculated by summing the difference between the rainfall amount and the mean rainfall with the cumulative deviation at the previous available year. Wet periods result in an increasing cumulative deviation while dry periods represent a descending cumulative deviation.
The results illustrated in Figure 10 may indicate a very persistent wet period. It indicates that the rainfall is above average almost continuously from 1923 to 1944, and below average from 1945 to 1980. The boundary between these two periods coincides with a probable change in administration of the data collection activities after World War II when many of the Italians in Eritrea were repatriated to Italy. It is not certain whether the difference is due to climate or changes in measurement activities, either methodology or reliability. This can be checked to some extent by examine crop yield records to see if they are consistently high for the wet period.
Figure 11 illustrates the results for Tessenei. This figure shows the sam wet period prior to 1942, but also shows greater variability in the period after, including the existence of some short wet periods.
Preliminary examination of cumulative deviations from the mean for different rainfall stations indicate either a wet climatic period from 1923 to 1944, or a difference in data collection techniques. Further examination of more extensive periods of record, different stations, and rainfall totals from different times of the year should give some indications of the reasons and factors resulting in high rainfall totals for this period.
Once the statistical characteristics of the days with rain and rainfall amount of the individual precipitation stations is understood, the next step in a statistical analysis is the evaluation of the relationships or correlations between stations. The degree of statistical interdependence (or independence) allows one to use the data from stations with long-term records to evaluate the long-term average quantities of shorter term stations together with confidence intervals for these estimated averages. Furthermore, the correlation, anti-correlation, and independence of the rainfall between stations may reveal aspects of the physical relationships and mechanisms of rainfall in Eritrea.
Since with approximately 100 potential rainfall stations to be analyzed, there are potentially 5,000 pair-wise correlations, we will divide our analysis into several regional analyses which will take advantage of the complete available data, and a larger analysis which will examine only the longer-term stations with the better data.
Similar to the analysis of the rainfall probability distributions for single stations, we propose a decomposition of the correlation analysis into 1) a correlation analysis for the rainfall amounts, and 2) a correlation analysis for the probability of rain.
For the correlation of rainfall amounts, we select stations which are relatively close in space, and select those days where there is rainfall at both stations. Then we examine the correlations of this data. Preliminary indications are that significant positive correlation exists only for stations that are within a few or several kilometers of each other, while for stations with larger separations the correlations are near zero or negative.
These very tentative results are reasonable on physical grounds, since the typical dimensions and travel distances of individual cumulonimbus clouds is a few kilometers. There might also be a directional dependence on these correlations of rainfall amounts since the rainfall pattern of a typical rain cloud is elongated in the direction of travel, which for much of Eritrea tends to be in a Northeast or Southwest direction.
With regards to the correlations of the probability of rain, there are several different components of these correlations which we hope to resolve. First we hope to resolve the typical distance scales of significant correlations for the probability of rain. If results obtained in other countries is an indication [Bern] typical distance scales might be one to several hundred kilometers. Second, we hope to use the correlation matrix to resolve typical spacial distributions for rainfall anomalies (since the eigenvectors of the correlation matrix will give the expected pattern of rainfall anomalies). If strong correlations exist, the patterns of rainfall anomalies will provide important information on typical rainfall mechanisms. In Eritrea there is also a well-known anti-correlation between rainfall on the central highlands and rainfall on the central eastern escarpment. Other more subtle relationships between regional and subregional rainfalls will also be important to elucidate.
Lastly, the correlations which are found will be used to reduce the error in the calculation of the long-term average of rain-days per month for those stations with less than 20 years of available data or those stations whose data is concentrated in a consistently wet or dry period (much of the most available Italian data is concentrated in the consistently wet period of 1920-1945).
As described in an earlier section, we divide Eritrea into 11 subclimatic zones for the sake of description of the precipitation patterns that exists. These zones are the 1) Northwestern Lowlands (NWL), 2) Southwestern Plains and Hills (SWL), 3) the Southwestern Escarpment (SWE), 4) the Central Highlands-South (CHS), 5) the Central Highlands-North (CHN), 6) the South Eastern Escarpment (SEE), 7) the Central Eastern Escarpment (CEE), 8) the North Eastern Escarpment (NEE), 9) the Northern Highlands (NH), 10) the North Eastern Lowlands (NEL), and 11) the South Eastern Lowlands (SEL). The extent of these regions is illustrated in Map A.
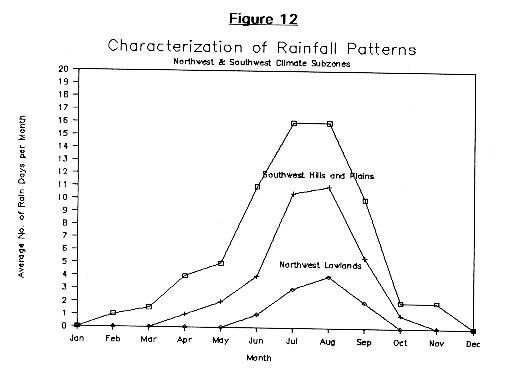
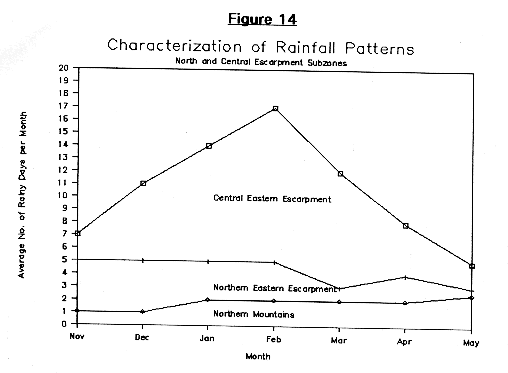
In this section, we interpret the rainfall patterns in each of these subregions, using the average number or rainy days per month as the basis of the evaluation. Figures 12 through 14 show the typical seasonal rainfall distributions for several of these regions. Figure 12 shows the distributions for the Northwest Lowlands and the Southwestern Plains and Hills. The upper curve deliminates the maximum average number of rainy days per month for the Southwestern Plains and Hills subregion, while the middle curve is approximately the minimum average number of rain days per month for stations in this region. This same middle curve also approximates the average number of rainy days per month for the wettest stations of the Northwestern Lowlands subregion, while the lowest curve indicates the minimum average number of rainy days per month for that same region. Hence the curves indicate the range of average monthly rainfall patterns that can exist for the different regions, and shows clearly how while the two subregions may have a similar form for the seasonal rain distribution, the magnitude of the monthly rainfall for the two regions are quite different with the northern one being far drier.
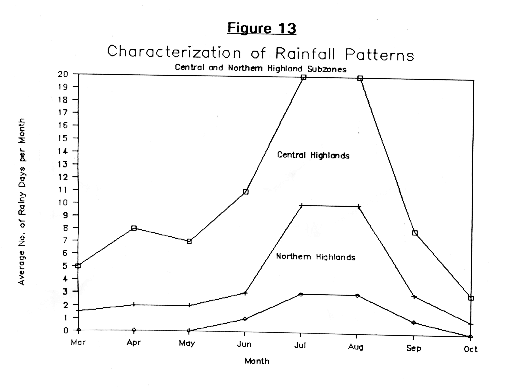
Similarly figure 13 shows a similar comparison between the two Central Highlands subregion and the Northern Highlands subregion, showing clearly the diminished Keremti rains and almost non-existent spring rains.
Furthermore figure 14 shows the winter and spring rainfall patterns for the Central Eastern Escarpment subregion, the Northern Eastern Escarpment Subregion, and the Northern Highlands. The figure indicates clearly how as one moves north of the high rainfall area near Faghena and Fil-Fil, the distinct rainfall peak around January and February diminishes to a nearly constant few rain days per month which become fewer as one moves West into the Northern Highlands. The boundaries between the different subclimatic rainfall patterns are of course approximate, and have a range of at least +-1 rainy day per month.
Below, we present brief descriptions of the climatic subregions. The subregional division is made so that in phase II of the study a detailed correlation and month-by-month rainfall analysis can be made.
This area includes the lowlands of the Barka River. This areas includes Agordat and Carcabet, with Sabderat to the South and Keren as a transitional station to the East. The typical rainfall pattern in this arid region is as follows:
| Jan | Feb | Mar | Apr | May | Jun | Jul | Aug | Sep | Oct | Nov | Dec |
| 0 | 0 | 0 | 0-1 | 0-2 | 1-3 | 3-10 | 4-11 | 2-5 | 0-1 | 0 | 0 |
where the numbers represent the average number of rainy days per month.
The general trend of decreasing rainfall from East to West and from South to North. The northern extreme of this region may be extremely dry with only about 100mm of rain on average near the border with the Sudan.
This region includes primarily the Gash-Setit province, and includes the towns of Barentu and Tessenei in the North, and Om Hajer and the Setit River to the South. This region is characterized by the following average rainfall pattern:
| Jan | Feb | Mar | Apr | May | Jun | Jul | Aug | Sep | Oct | Nov | Dec |
| 0 | 0-1 | 0-1.5 | 1-4 | 2-5 | 4-11 | 9-16 | 11-16 | 6-10 | 0-2 | 0-2 | 0 |
where the numbers represent the average number of rainy days per month. This rainfall represents a broad peak in early August brought on by the arrival subsequent retreat of the ITCZ (intertropical convergence zone), and the keremti rains. There are several distinct trends or tendencies observed in this zone:
The degree of these enhancement effects may be as follows: as one goes north from Om Hajer to Tessenei, the rainfall decreases approximately 25%. As one heads West from Barentu to Tessenei, there is a 17% decrease in rainfall. As one moves from Barentu to Cullucu on a south facing slope or trend, there seems to be a 25% enhancement
This region is bounded to the West by Adi Ugri and Adi Quala, to the East by Senafe and Adi Kaieh, and to the North by Decamere and Debaroa. It is characterized by the following rainfall distribution:
| Jan | Feb | Mar | Apr | May | Jun | Jul | Aug | Sep | Oct | Nov | Dec |
| 0-3 | 0-3 | 1-5 | 4-8 | 4-7 | 5-11 | 15-21 | 12-21 | 2-8 | 0.5-3 | 0-3 | 0-2 |
This rainfall pattern represents a combination of two types of rain, a small spring rain in April and May combined with the main Keremti rains which begin in June or July and last through August, ending abruptly in September. There are some very minor rains in January, February, November and December at the higher altitude stations and at those stations in the Eastern-most edge of the region. These rains are produced by moisture brought from the Red Sea basin by the Northeast monsoon.
Some of the trends that are observed in this region include:
This region is bounded to the North by Adi Teclezan and Elabared, to the West by Himberti, to the East by Zagr, Beleza, and Asmara, and to the South by Debaroa. Elabared, Keren, Nefasit, and Debaroa can be viewed as transitional stations for this region. This region is characterized by the following rainfall distribution:
| Jan | Feb | Mar | Apr | May | Jun | Jul | Aug | Sep | Oct | Nov | Dec |
| 0-1 | 0-2 | 1-2 | 2-6 | 2-7 | 3-6 | 11-17 | 11-17 | 3-6 | 0.5-3 | 0-3 | 0-1 |
The rainfall pattern in the Central Highlands is similar to that of the southern highlands, but besides a general 20% decrease in rainy days, there is a distinct decrease in the spring rains, especially those of June.
This region is comprised of the canyons and slopes bordered on the West by the ridge connecting Decamere, Adi Kaieh, and Senafe, and is bordered on the East the by Eastern lowlands and plains. There is almost no data for this region, but some of the general characteristics of the rainfall of this area can be deduced from the surrounding areas. At the northern boundary of this region, there are significant winter and spring rains with 2-6 rainy days per month for all months but July and August. As one proceeds South, the winter rains diminish to almost zero at latitudes lower than Adi Kaieh. Meanwhile there still may be significant (1-4 days/month) spring rains for the higher altitude areas. The July and August Keremti Rains are 12-16 days/month at the ridge-tops, but rapidly decrease to probably below 4-9 days per month by the time one reaches an elevation of 1500 meters and only a few days per month by the time one reaches 1000 meters.
This region is bordered to the North by Gheleb, to the East by the edge of the plateau or escarpment, to the South by Ghinda or Nefasit, and to the East by Damas.
This is the wettest region of Eritrea although the higher precipitation (~1000 mm) areas are highly localized. Most of the rainfall arrives in the winter during the Northwestern Monsoon. Much of the region is characterized by the following rainfall pattern (in average rainfall days per month):
| Jan | Feb | Mar | Apr | May | Jun | Jul | Aug | Sep | Oct | Nov | Dec |
| 6-14 | 5-17 | 3-12 | 4-8 | 2-5 | 1-3 | 5-11 | 5-10 | 1-3 | 3-5 | 3-7 | 5-11 |
This is a double-peak rainfall pattern with one peak in February and another in July or August. The winter rains are the result of the Northeast Monsoon which forces the humid Red Sea basin air mass against the Eastern Escarpment, which when combined with favorable upper atmospheric conditions will result in destabilization and precipitation.
There are several features of this area that may contribute to the enhanced rainfall:
Due to some or all of these special localized features, there is a confined subregion with enhanced rainfall. But this region of high rainfall enhancement does not extend much beyond an area of approximately 600 km² which includes Ghinda, Faghena, Fil-Fil, Merara, Abba Maitan, and Mount Sabur.
This region is far drier that then Central-Eastern Escarpment, though there is some orographic enhancement of rains produced by the Northeast Monsoon. This region includes Afeabet, Alghena, Kelamet, and Karora. The typical distribution of average number of rainy days per month is as follows:
| Jan | Feb | Mar | Apr | May | Jun | Jul | Aug | Sep | Oct | Nov | Dec |
| 2-4 | 2-5 | 2-3 | 2-5 | 3-4 | 3-5 | 4-9 | 2-8 | 1-4 | 1-3 | 1-7 | 1-5 |
Note, that in this region, there is consistently a small number of rainy days each month of the year, with some increase in the July and August rain due to the spill-over of the Keremti rains during these months. But in general conditions are quite dry.
This region extends from Gheleb North and West to the Sudanese Border, and includes Nacfa, Erota, Rora, and much of the Northern Anseba River basin.
In this region, the rainfall is much like that of the central highlands, but is greatly diminished:
| Jan | Feb | Mar | Apr | May | Jun | Jul | Aug | Sep | Oct | Nov | Dec |
| 0-2 | 0-2 | 0-2 | 0-3 | 0-4 | 1-3 | 3-7 | 3-9 | 1-3 | 0-2 | 0-2 | 0-1 |
Generally the rainfall is enhanced in the higher mountains near Nacfa, being diminished in the lower elevations and to the West.
This subregion is bounded to the South by Irafale, and to the North by the Sudanese border. Its Eastern boundary is 5-15 km from the eastern escarpment. This region includes Massawa, Zula, and Marsa Teclay. This region is distinct from the south eastern lowlands by its greater exposure to weather systems originating from the north and its proximity to the eastern escarpment which can produce some rainfall enhancement in this region. The typical rainfall patterns in this region are as follows:
| Jan | Feb | Mar | Apr | May | Jun | Jul | Aug | Sep | Oct | Nov | Dec |
| 1-5 | 3-7 | 0-4 | 0-2 | 0-1 | 0-1 | 0-3 | 0-3 | 0-1 | 0-1 | 1-2 | 1-3 |
As one approaches the northern extremes of this region, the contribution from the keremti rains diminishes, and the winter rains become more prevalent.
This subregion extends from Mersa Fatma to Assab. It is an extremely dry region and includes the driest area of Eritrea, the Danakil Depression. The typical rainfall patterns are:
| Jan | Feb | Mar | Apr | May | Jun | Jul | Aug | Sep | Oct | Nov | Dec |
| 0-1 | 0-3 | 0-1 | 0-1 | 0-0.5 | 0 | 0-3 | 0-3 | 0-1 | 0-1 | 0-2 | 0-1 |
There is probably some enhancement of rain, especially the winter rains as one proceeds North, and some orographic enhancement in the hills and mountains, but these effects are small considering the overall paucity of rainfall.
The preliminary indications of this study of the climatology of Eritrean precipitation are that the existing data can provide insights into the nature and characteristics of rainfall in Eritrea. Currently, except for some summaries and average values, little specific information is known about precipitation or water resources in Eritrea. Continuing studies along these lines should help develop the analytical tools and methodology for planning and evaluation of both development projects and drought management strategies.