By:

Robert Van Buskirk, Ph.D.
Eritrea Technical Exchange Project
3217 College Ave
Berkeley, CA 94705
In this report we provide the CO2 Verified Emissions Reduction (VER's) estimate for the Eritrean Dissemination of Improved Stove Program (EDISP) for two villages and an Internally Displaced Persons (IDP) camp. The background, purpose and justification for the EDISP project is provided in the project design document. The project design document also provides the description of the CO2 emissions estimation methodology (we reprint an edited version of methodology from the project document in Appendix A). Since the project design document was written, the village interview form has been substantially modified, and is included as an appendix to this report.
The amount of VER's of vintage 2003/2004 for the 2 villages and IDP camp is estimated at more than 4902 tonnes with an average of 2.34 tonnes VER per stove. The VER per stove is lower than the 3 tonnes per stove estimated in the Project Document because the fraction of wood fuel used by households appears to be lower than the fraction of wood fuel estimated at that time. Note that the VER estimate is very conservative, and it is likely that the carbon sequestration arising from stove projects in the villages visited exceed 7500 tonnes. See http://www.punchdown.org/rvb/mogogo/EDISPICRCEval200406.pdf for a detailed discussion and the results of a follow-up evaluation performed in June 2004.
| Village/Camp | Stoves | VER/village (2003/4 tonnes) |
VER/Stove (tonnes) |
| da`ero | 105 | 115 | 0.85 |
| hazega | 105 | 71 | 0.68 |
| `adi qexi | 2000 | 4826 | 2.41 |
| TOTAL | 2210 | 4989 | 2.26 |
The VER's all have the vintage year of 2003/4 which is determined by the calendar year in which the improved stove is installed in the village household. The 2 villages and IDP camp were selected out of a total of over 50 villages and communities in the EDISP project based on the criteria of logistical convenience (for data collection) and how recent the stove installations were made. A fairly complete list of EDISP villages is provided in Appendix B.
Any quantitative estimate of project impacts is subject to potentially substantial uncertainties. Reduction of errors and uncertainties to small levels often requires extensive data collection, research activities that can be quite expensive. Data collection, research and monitoring activities for the EDISP project were constrained to be less than to 15% of the value of the VER's or less than $4,000.
The VER estimates are made in a conservative and transparent mannter. The original village interview forms are available for inspection at EDOE's Energy Research and Training Center (ERTC) in Asmara; The transcribed data and VER estimation calculations are provided in a publically available spreadsheet (the spreadsheet, MogogoData20040331.xls, accompanies this report); Photo documentation of the verification visits is provided; and any interested party can visit the project villages with a translator and confirm the veracity of monitoring data through independent interviews and surveys.
There are many factors and uncertainties that can affect EDISP project greenhouse gas impacts. Different assumptions, approximations, and unaccounted-for factors may result in more, less, or unknown changes in project VER's. Fundamentally, the certainty of a VER estimate is a matter of judgement and risk evaluation.
Potential factors that may result in a lower VER estimate include:
Factors that may result in a higher VER estimate include:
Factors that may have a significant, but unknown impact on VER estimates:
On balance, given the various factors and their potential impact on the VER estimate, it is more likely that the VER estimate in this report is conservative: That is, the CO2 emissions reductions estimate provided in this report has a greater than 50% chance of being lower than the actual CO2 emissions reductions provided by the stove project. In fact, in this study the IDP was visited several times, and one of the lower estimates of emissions reduction is used in this report.
The implementation of the EDISP project is a collaborative activity of grassroots villages organizations, the local government institutions at the regional level, EDOE, and sometimes international organizations.
Village-level organizations such as the local women's committee provide the grassroots organization for community involvement and the day-to-day implementation of the improved stove project.
The local government administration discusses and communicates the project possibilities, requirements, and objectives with the local communities and manages the implementation of individual projects. It also balances the needs of different villages, setting quotas that set the amount of material distributed to different villages. The count of stoves in each village is determined by household project sign-up lists and the amount of material distributed to the different villages.
The Department of Energy of the State of Eritrea sets standards programs and procedures for project implementation and design, provides technical and design services for the communities and local governments, distributes non-local project materials and equipment to the local government administration when needed, and interacts with international funders and scientists.
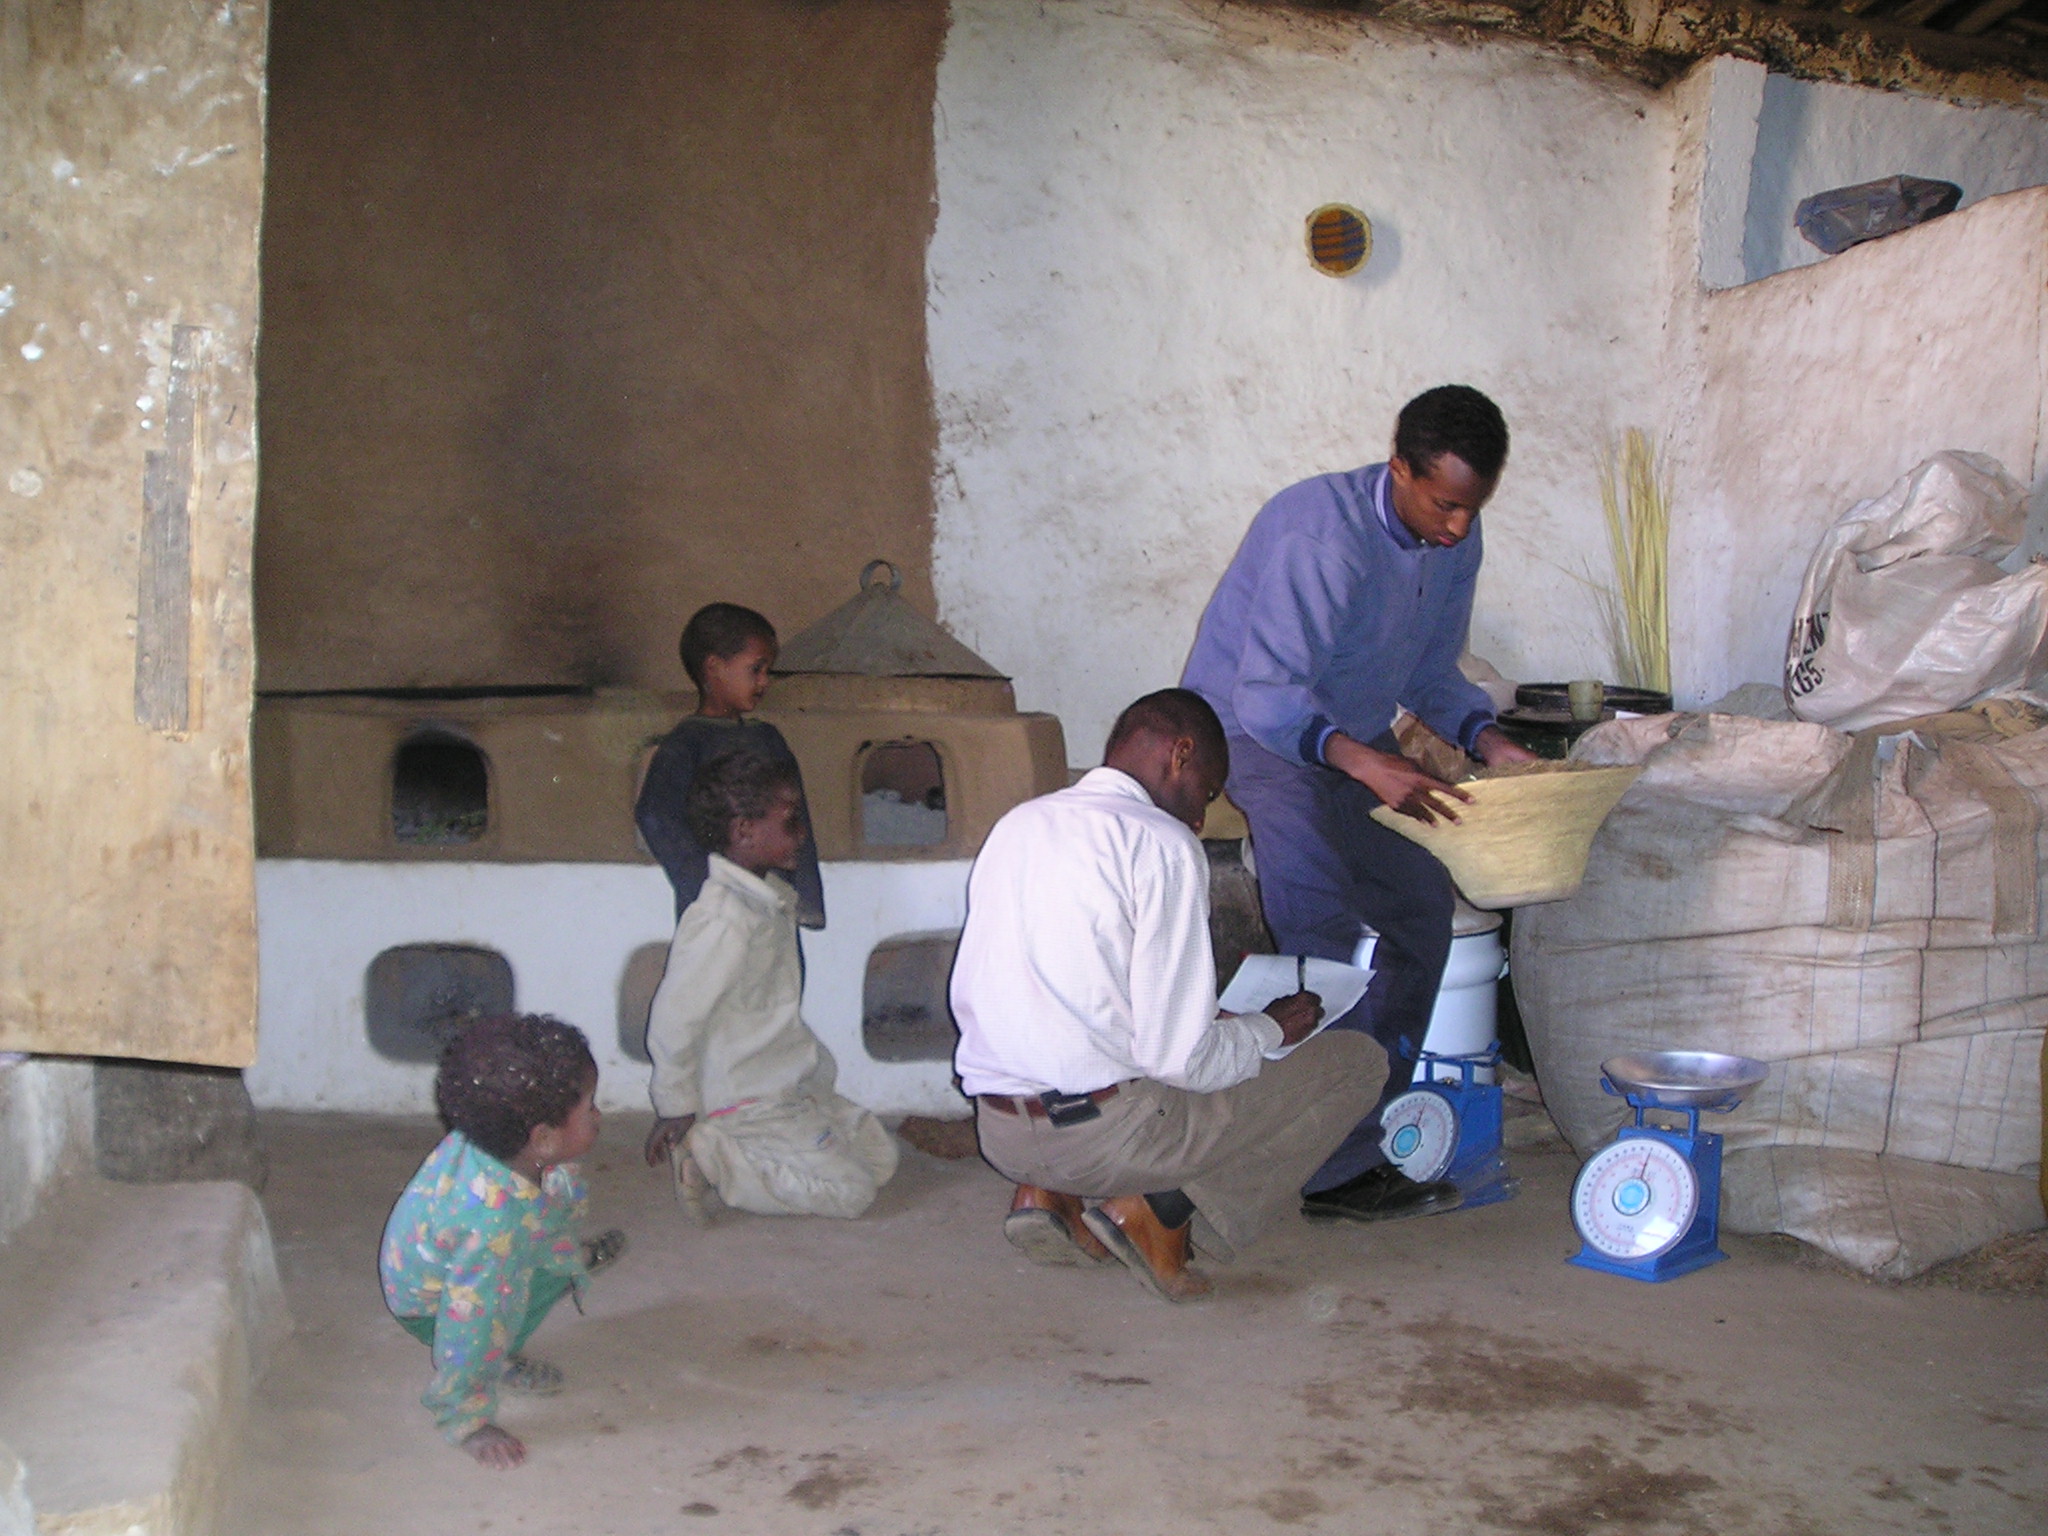
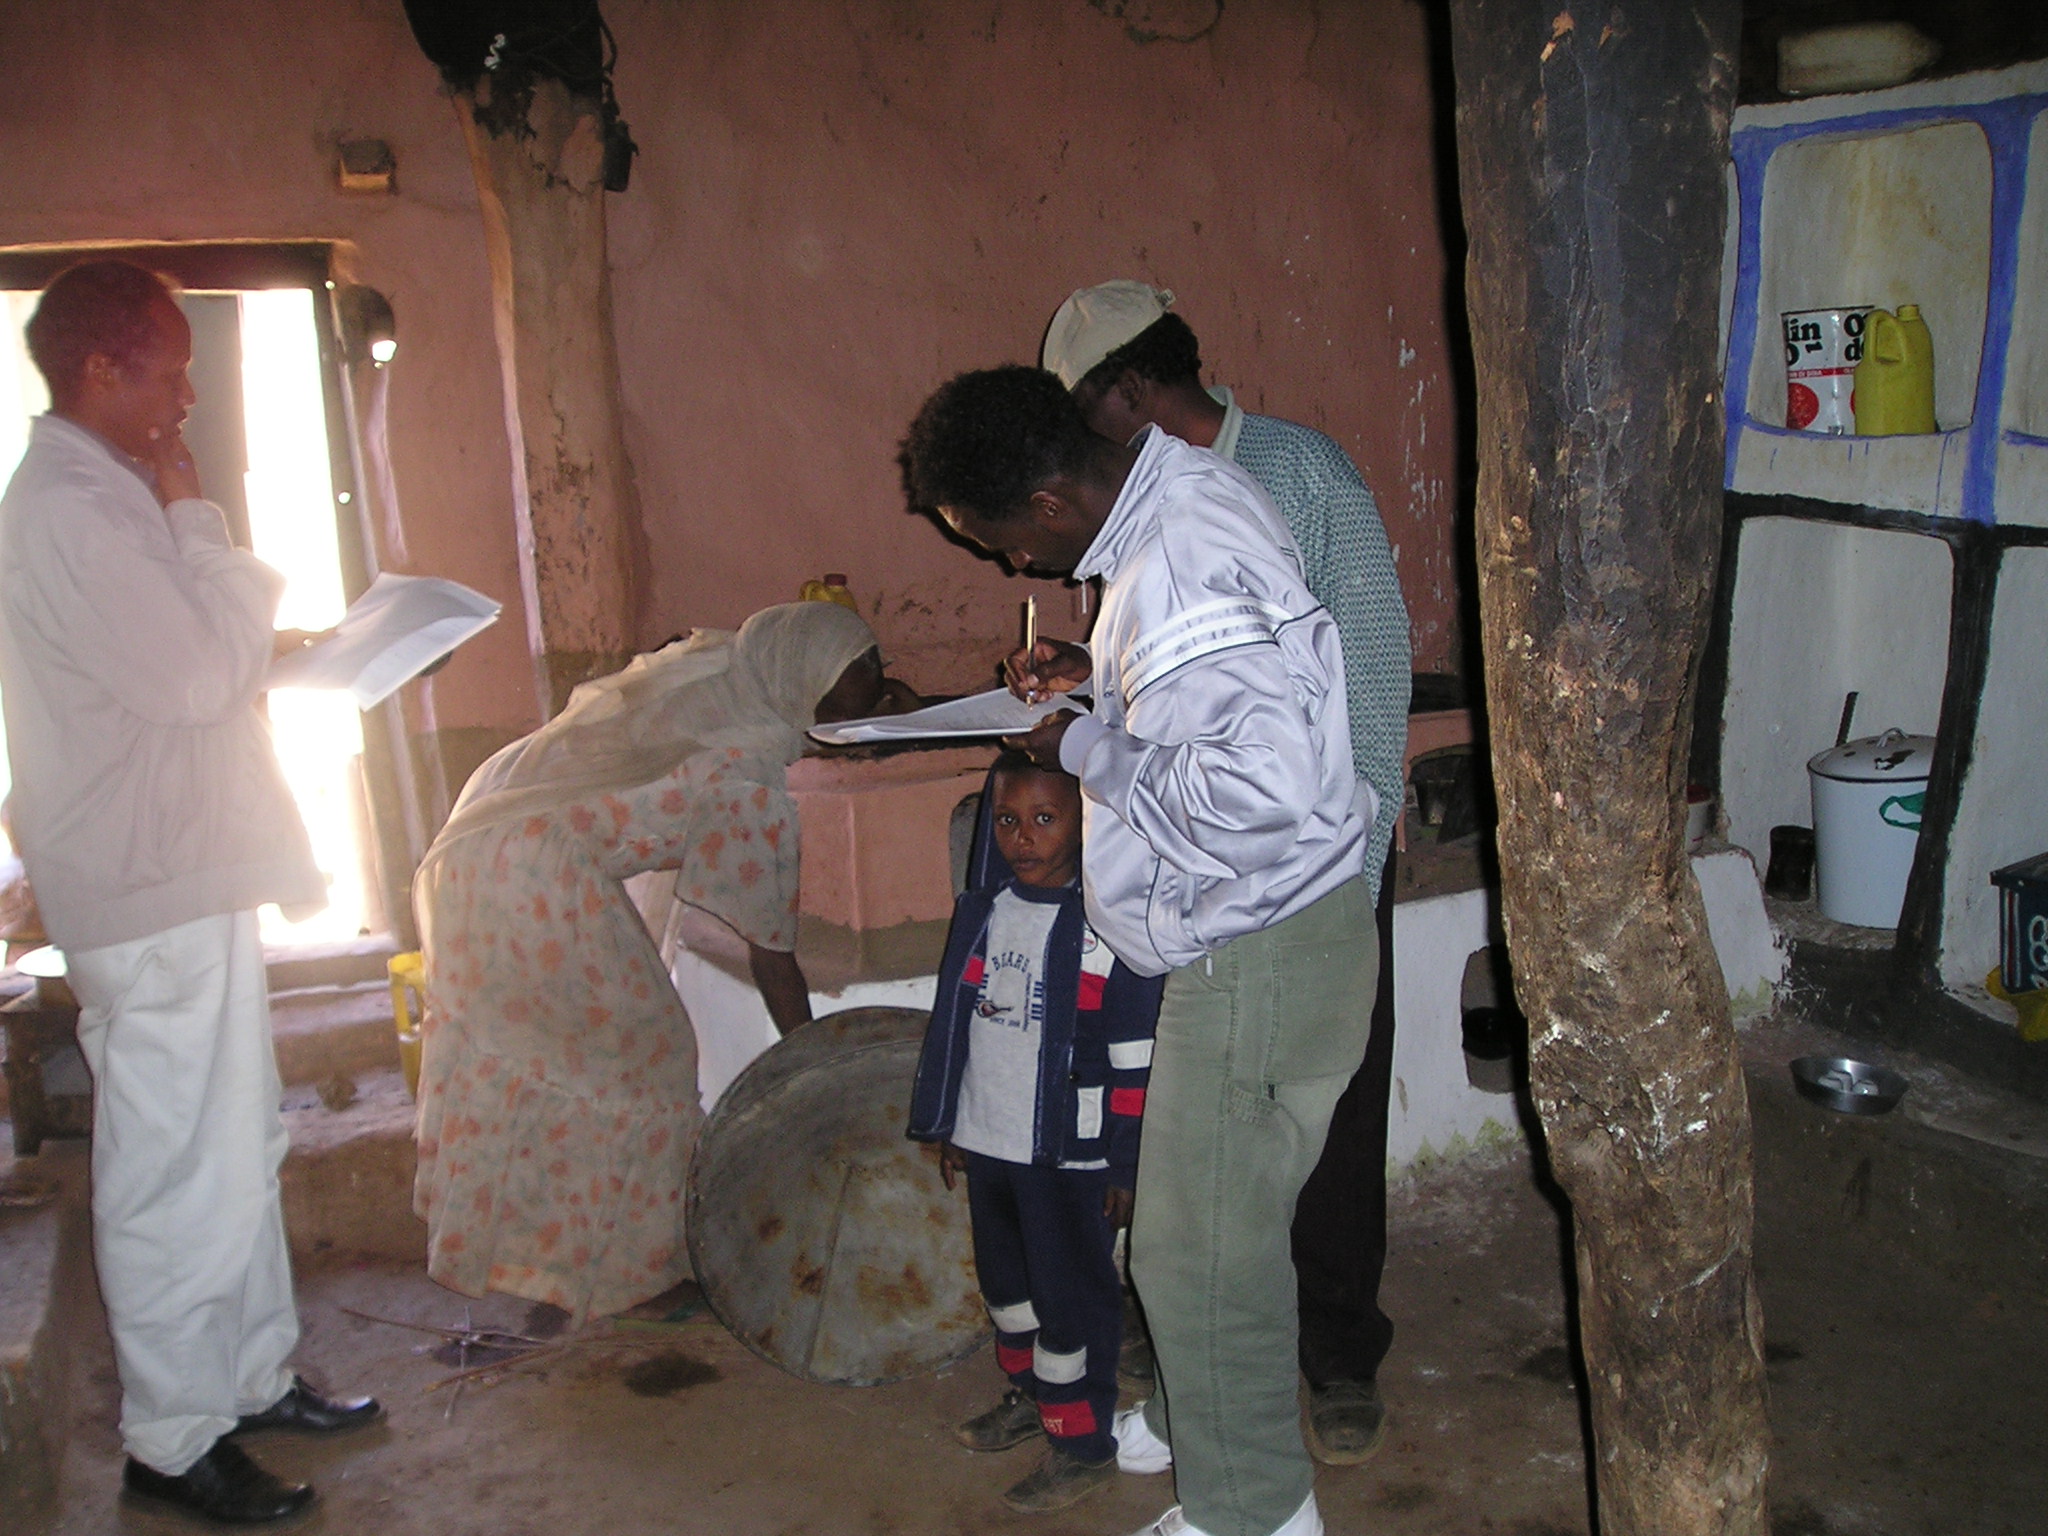
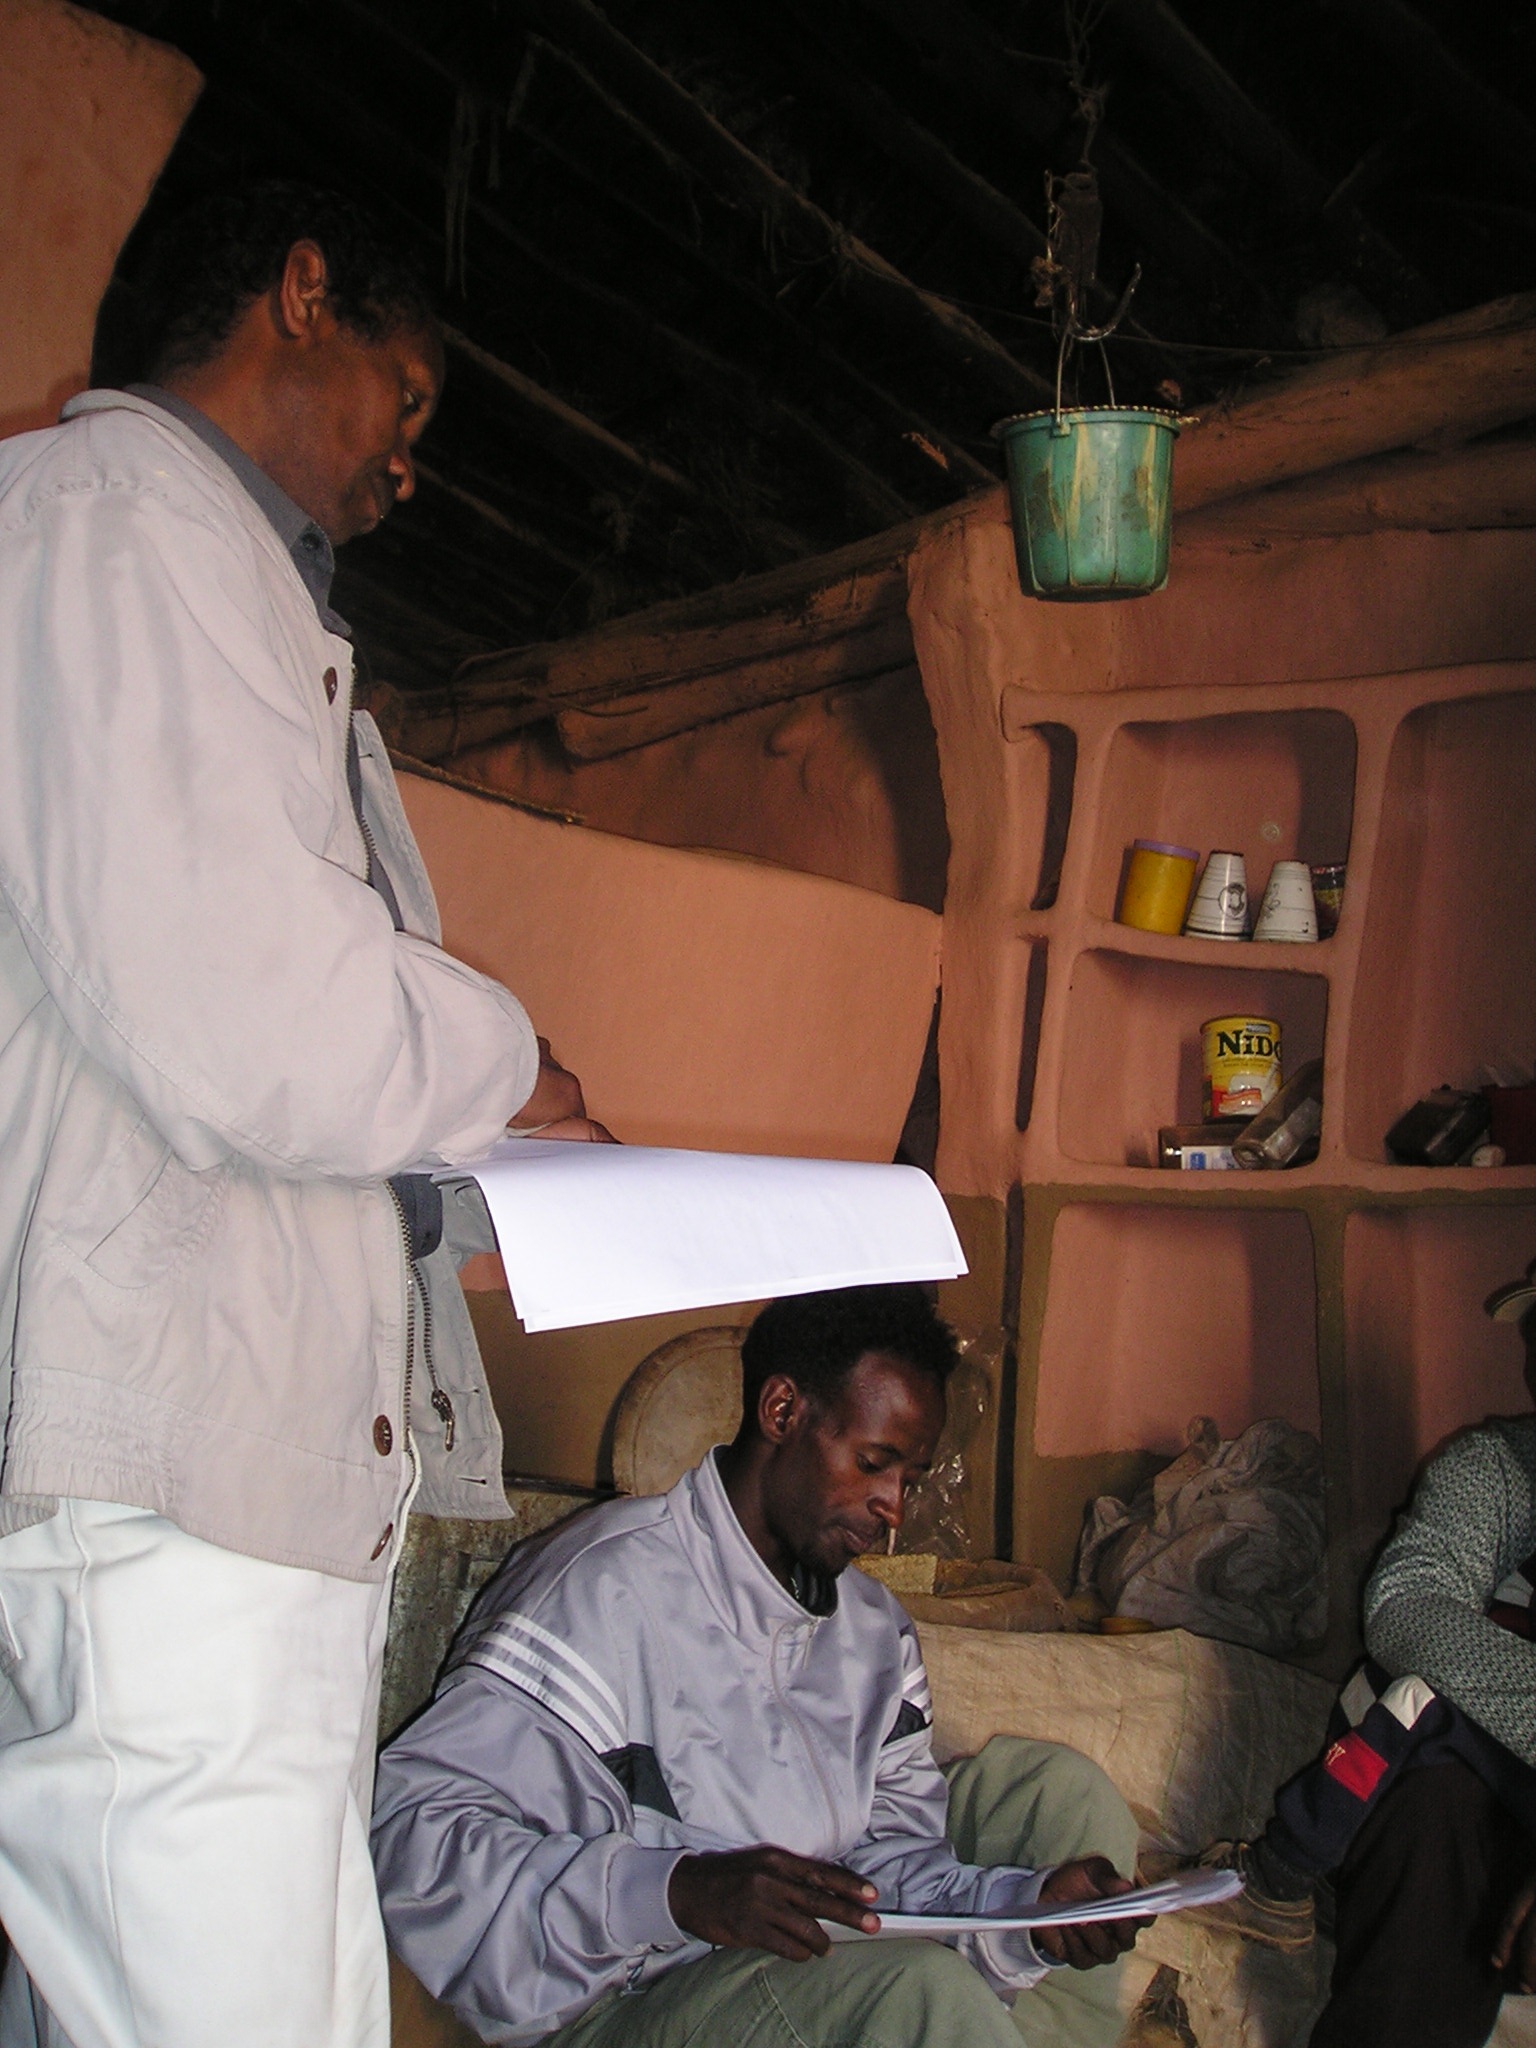
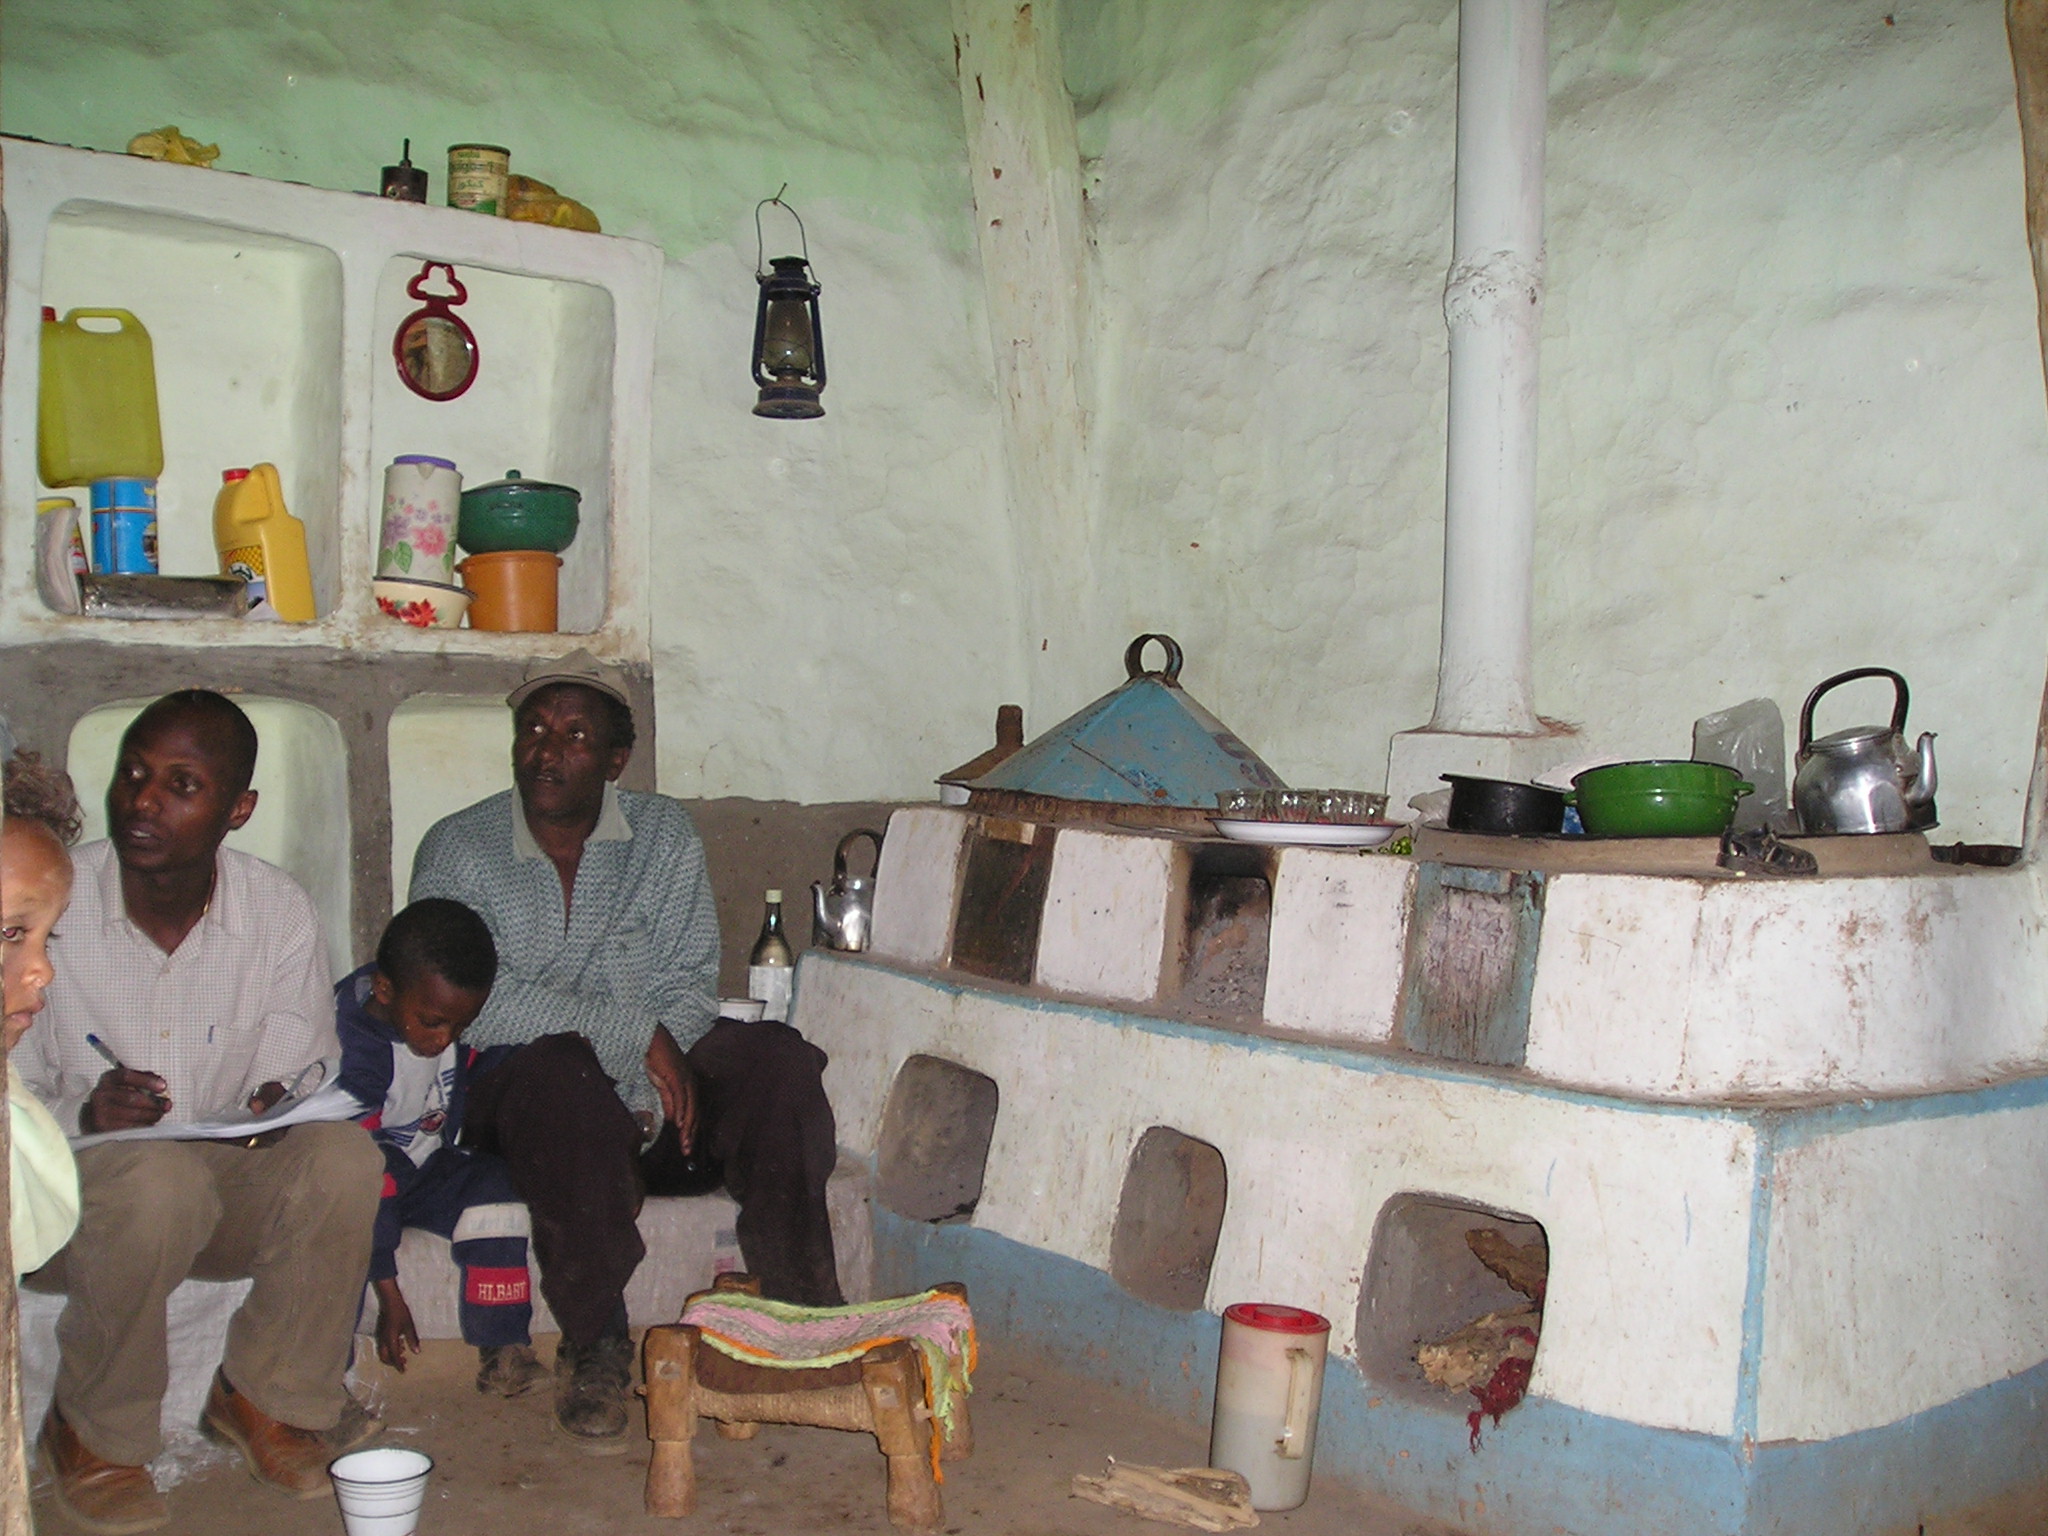
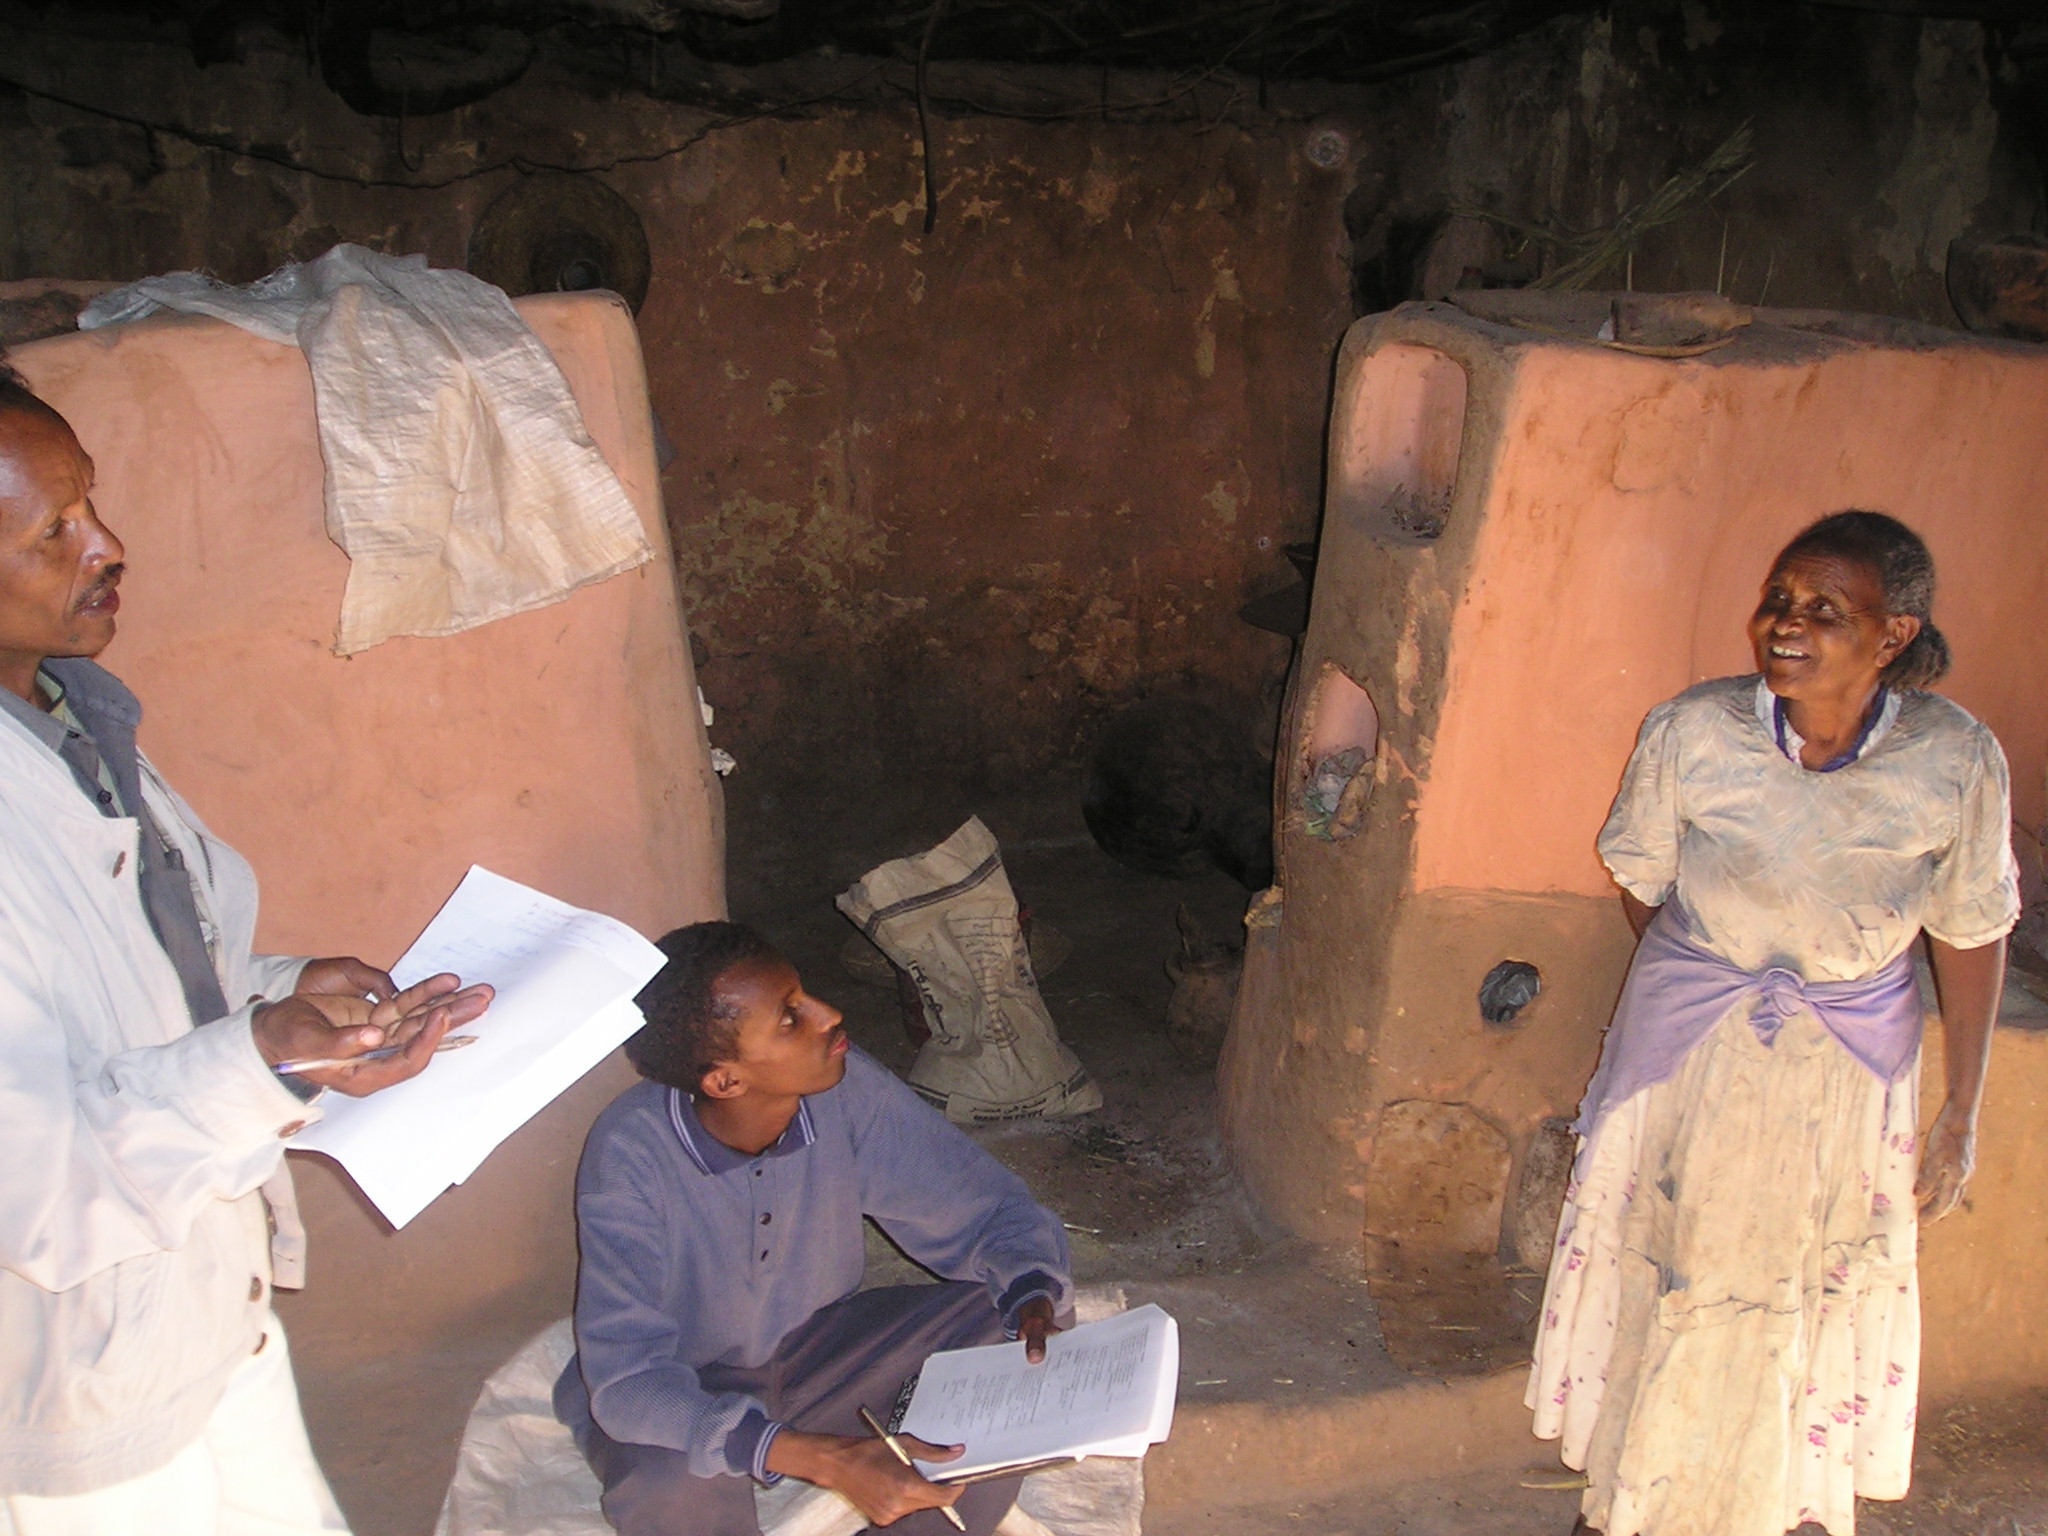
Presently, the local government administration reports to the EDOE the number of stoves installed in each village project. In some villages the project implementer/organizer may be an NGO or the Ministry of Agriculture home economics office. To monitor project impacts, EDOE selected villages from the list of projects provided by the local government administration, and sent teams of interviewers to the individual villages. Interviewers contacted local project organizers and conducted 10 household interviews in each village equiped with scales and measuring tapes to measure stove dimensions, bread weight, and fuel use. The filled-in interview forms are then kept on file at the Energy Research and Training Center where they were later entered into spreadsheets and used for carbon emissions reduction calculations. The results of the data entry and calculations are presented in and Excel spreadsheet accompanying this report
In contrast to established villages, IDP camps may be administered by international organizations like the International Committee of the Red Cross (ICRC). The ICRC provides general support for the IDP communities, while for stove projects EDOE provides technical support, training, monitoring, evaluation, and may provide some contribution of materials. In the case of `adi qexi the detailed monitoring and evaluation required for the carbon credit verification helped identify installation problems in the project. When these problems are corrected, this should help subtantially increase both fuel and carbon emissions savings beyond the significant savings documented in this report.
Specific verification activities consisted of reviewing the data from the village interviews, and visiting a relatively small subset of the more than one dozen villages and communties that had stove projects in 2003. The focus of the verification efforts was the largest stove project for the year which was in the `adi qexi IDP camp. The villages visited during the course of the verification activities from December 30, 2003 to January 6, 2004 included:
Data was also collected by ICRC staff for the metera and may wuray IDP camps. But with the limited available for verification activities, it was difficult to verify the quality of the data collecting during the ICRC interviews.
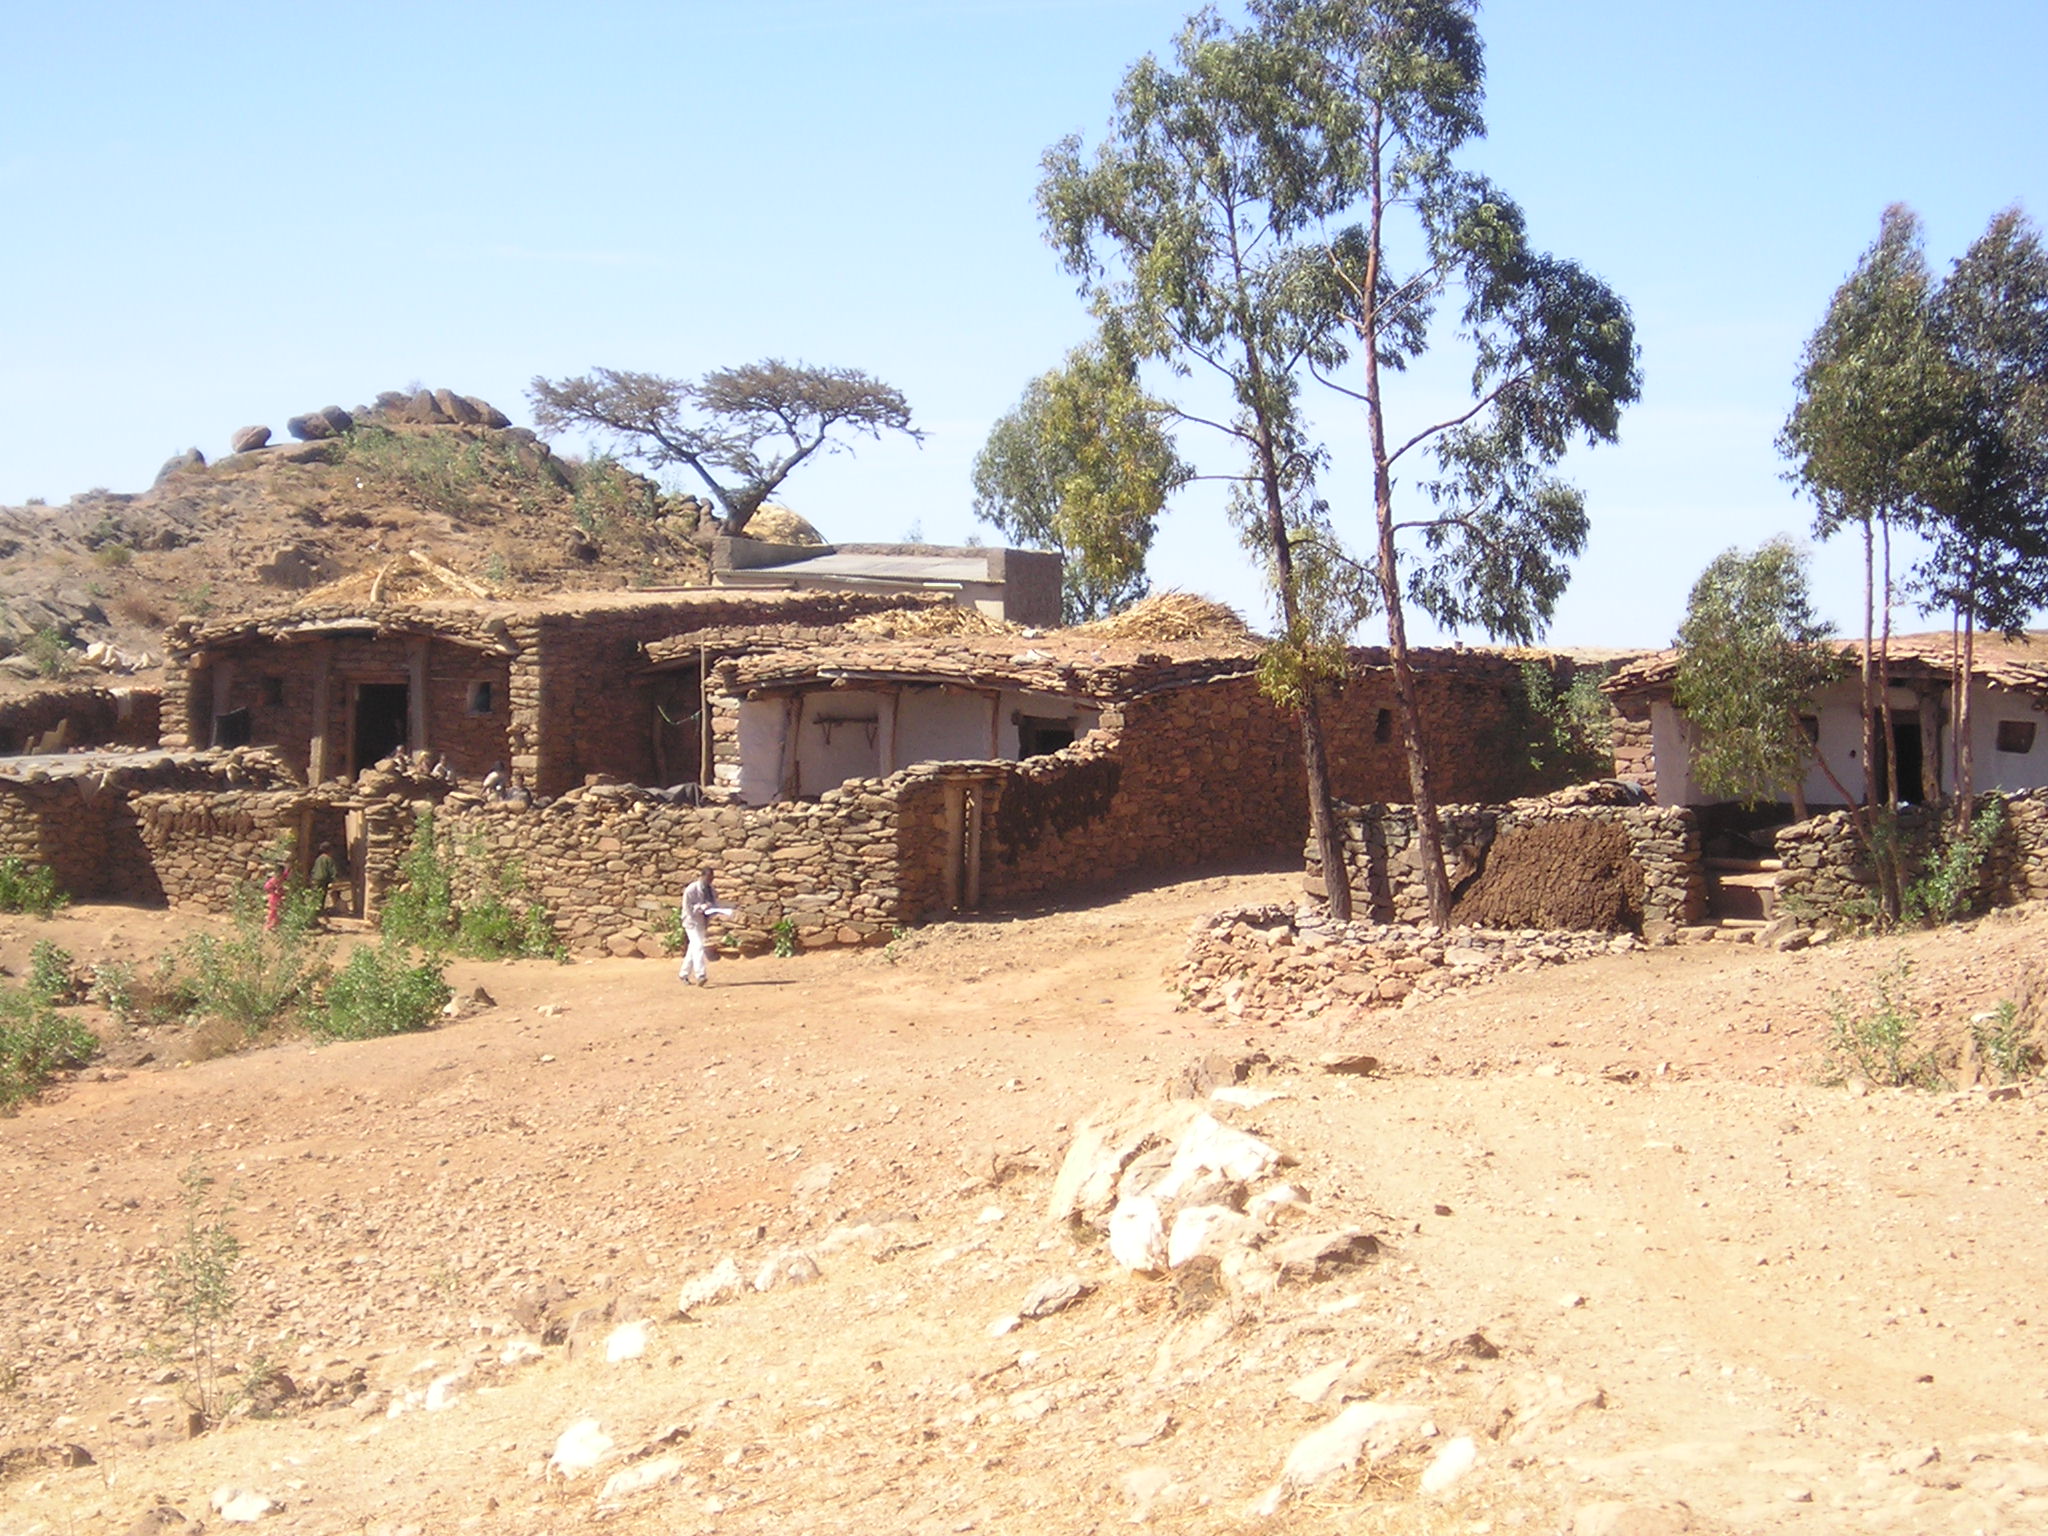
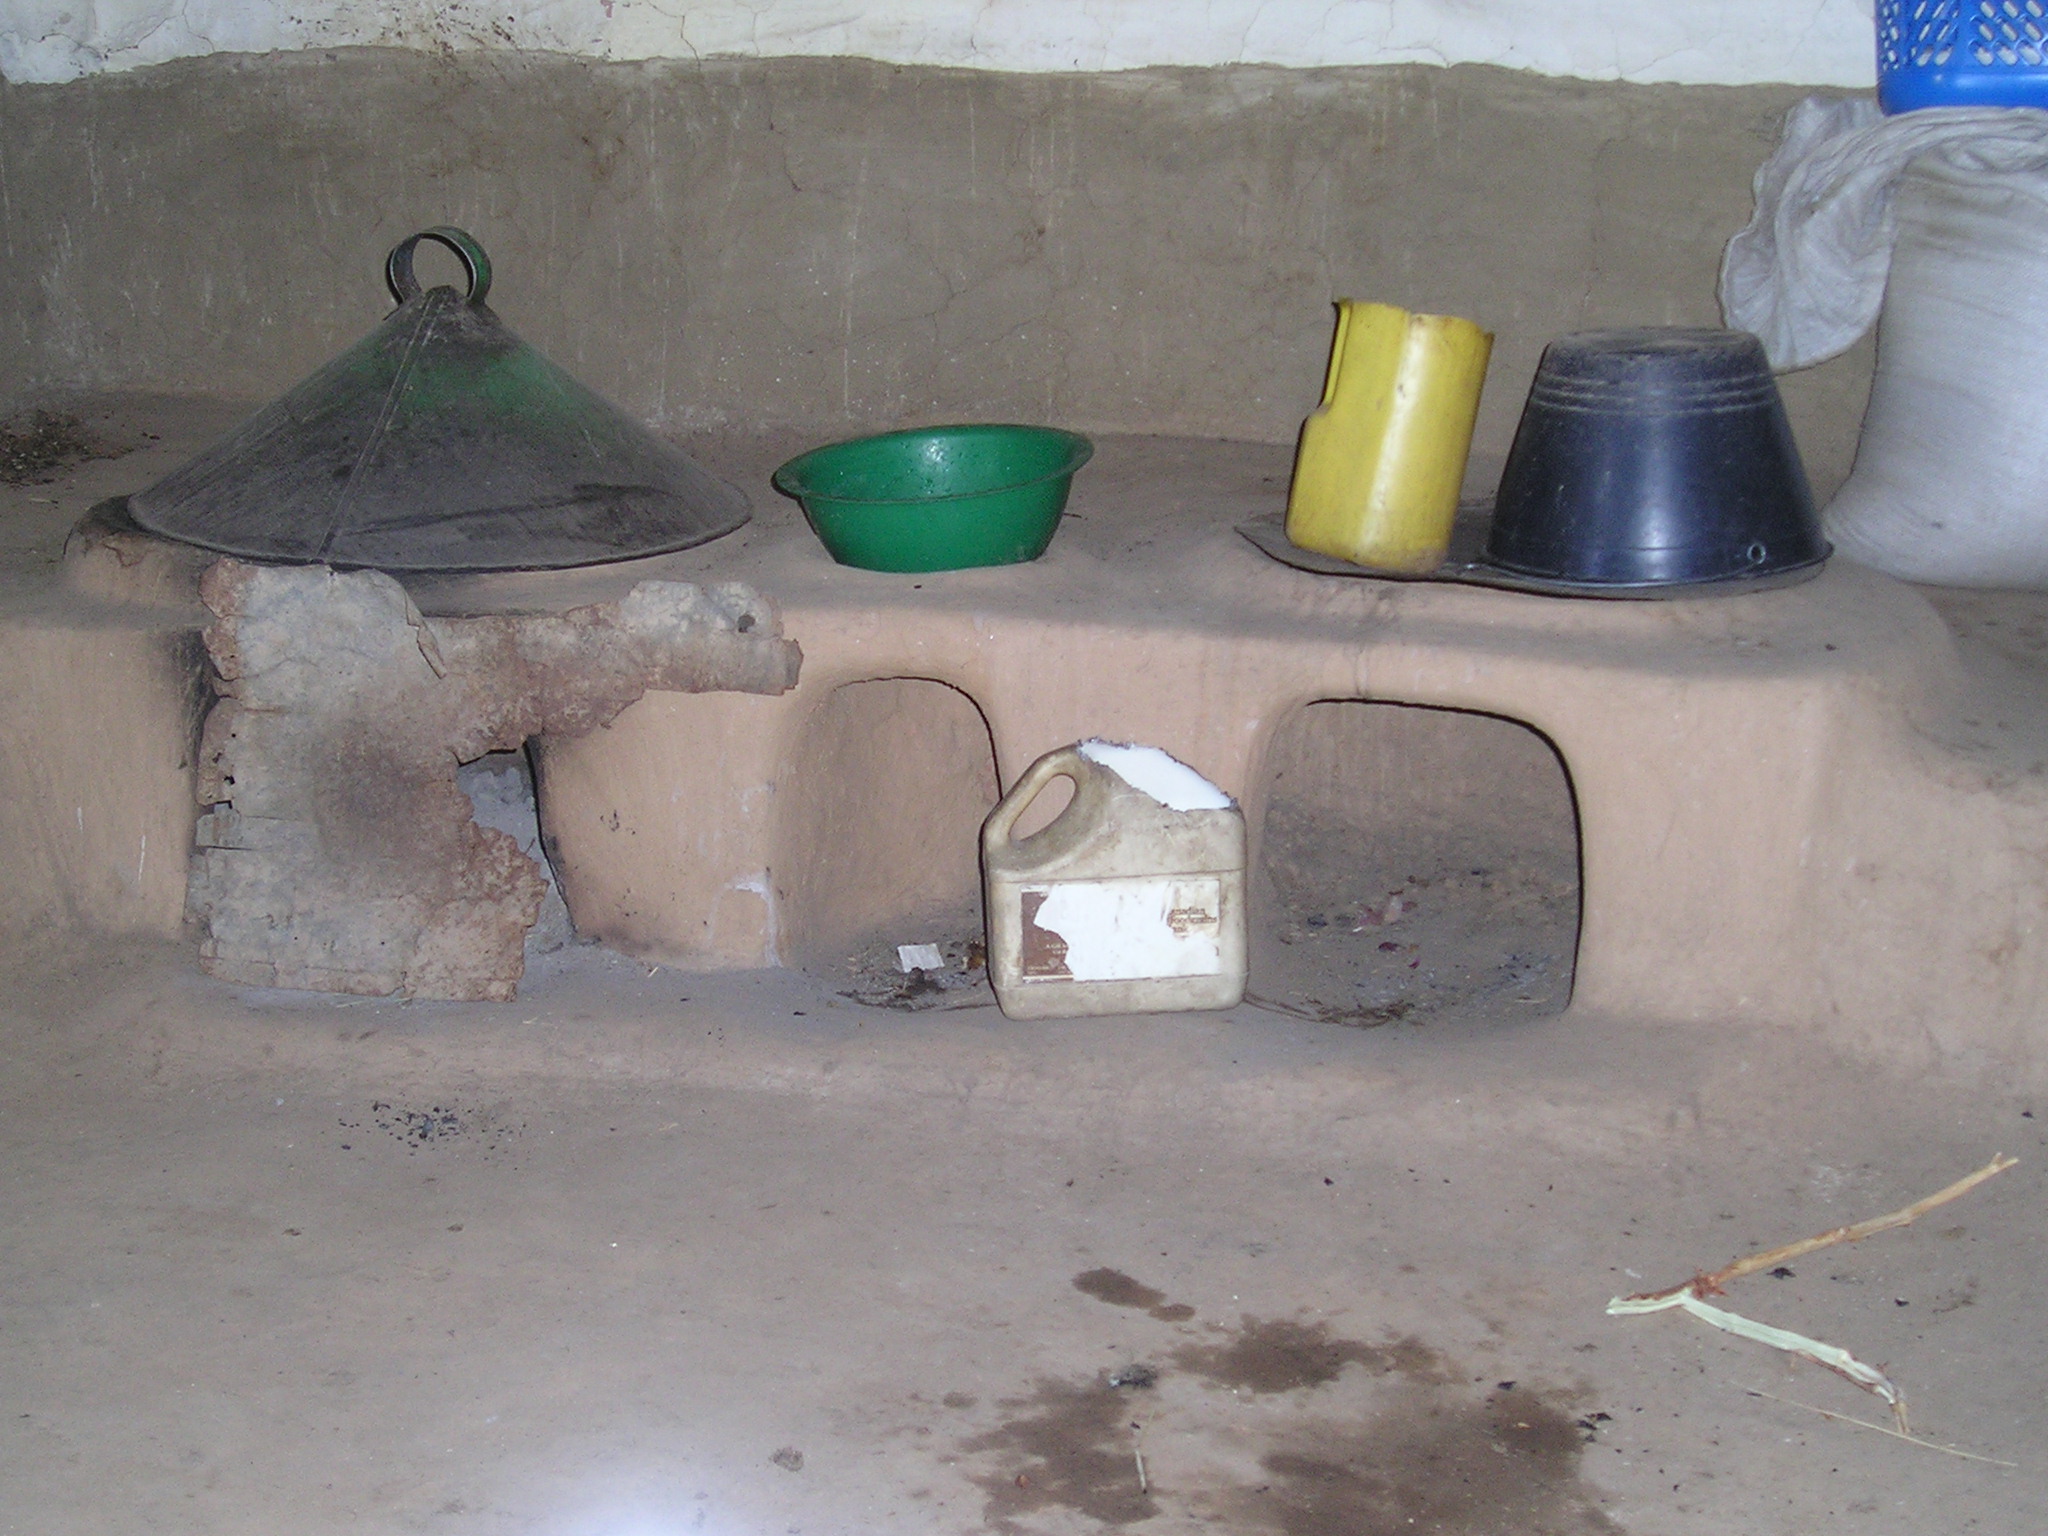
A verification visit was made to da`ero on December 30, 2003. During the visit, the local women community organizer related that 60 of a total of 105 planned installations was completed. EDOE staff divided into two groups and conducted a total 10 interviews. Interview activity was photo-documented for houses #2, #3, #4, and #5, amongst others. It was found that the verified carbon credits per stove in this village were fairly small due to the very high prevalence of dung for fuel (which has a short lifetime in the ecosystem, so reduced dung harvesting does to result in much carbon sequestration). The houses in da`ero were often of traditional hidmo construction.
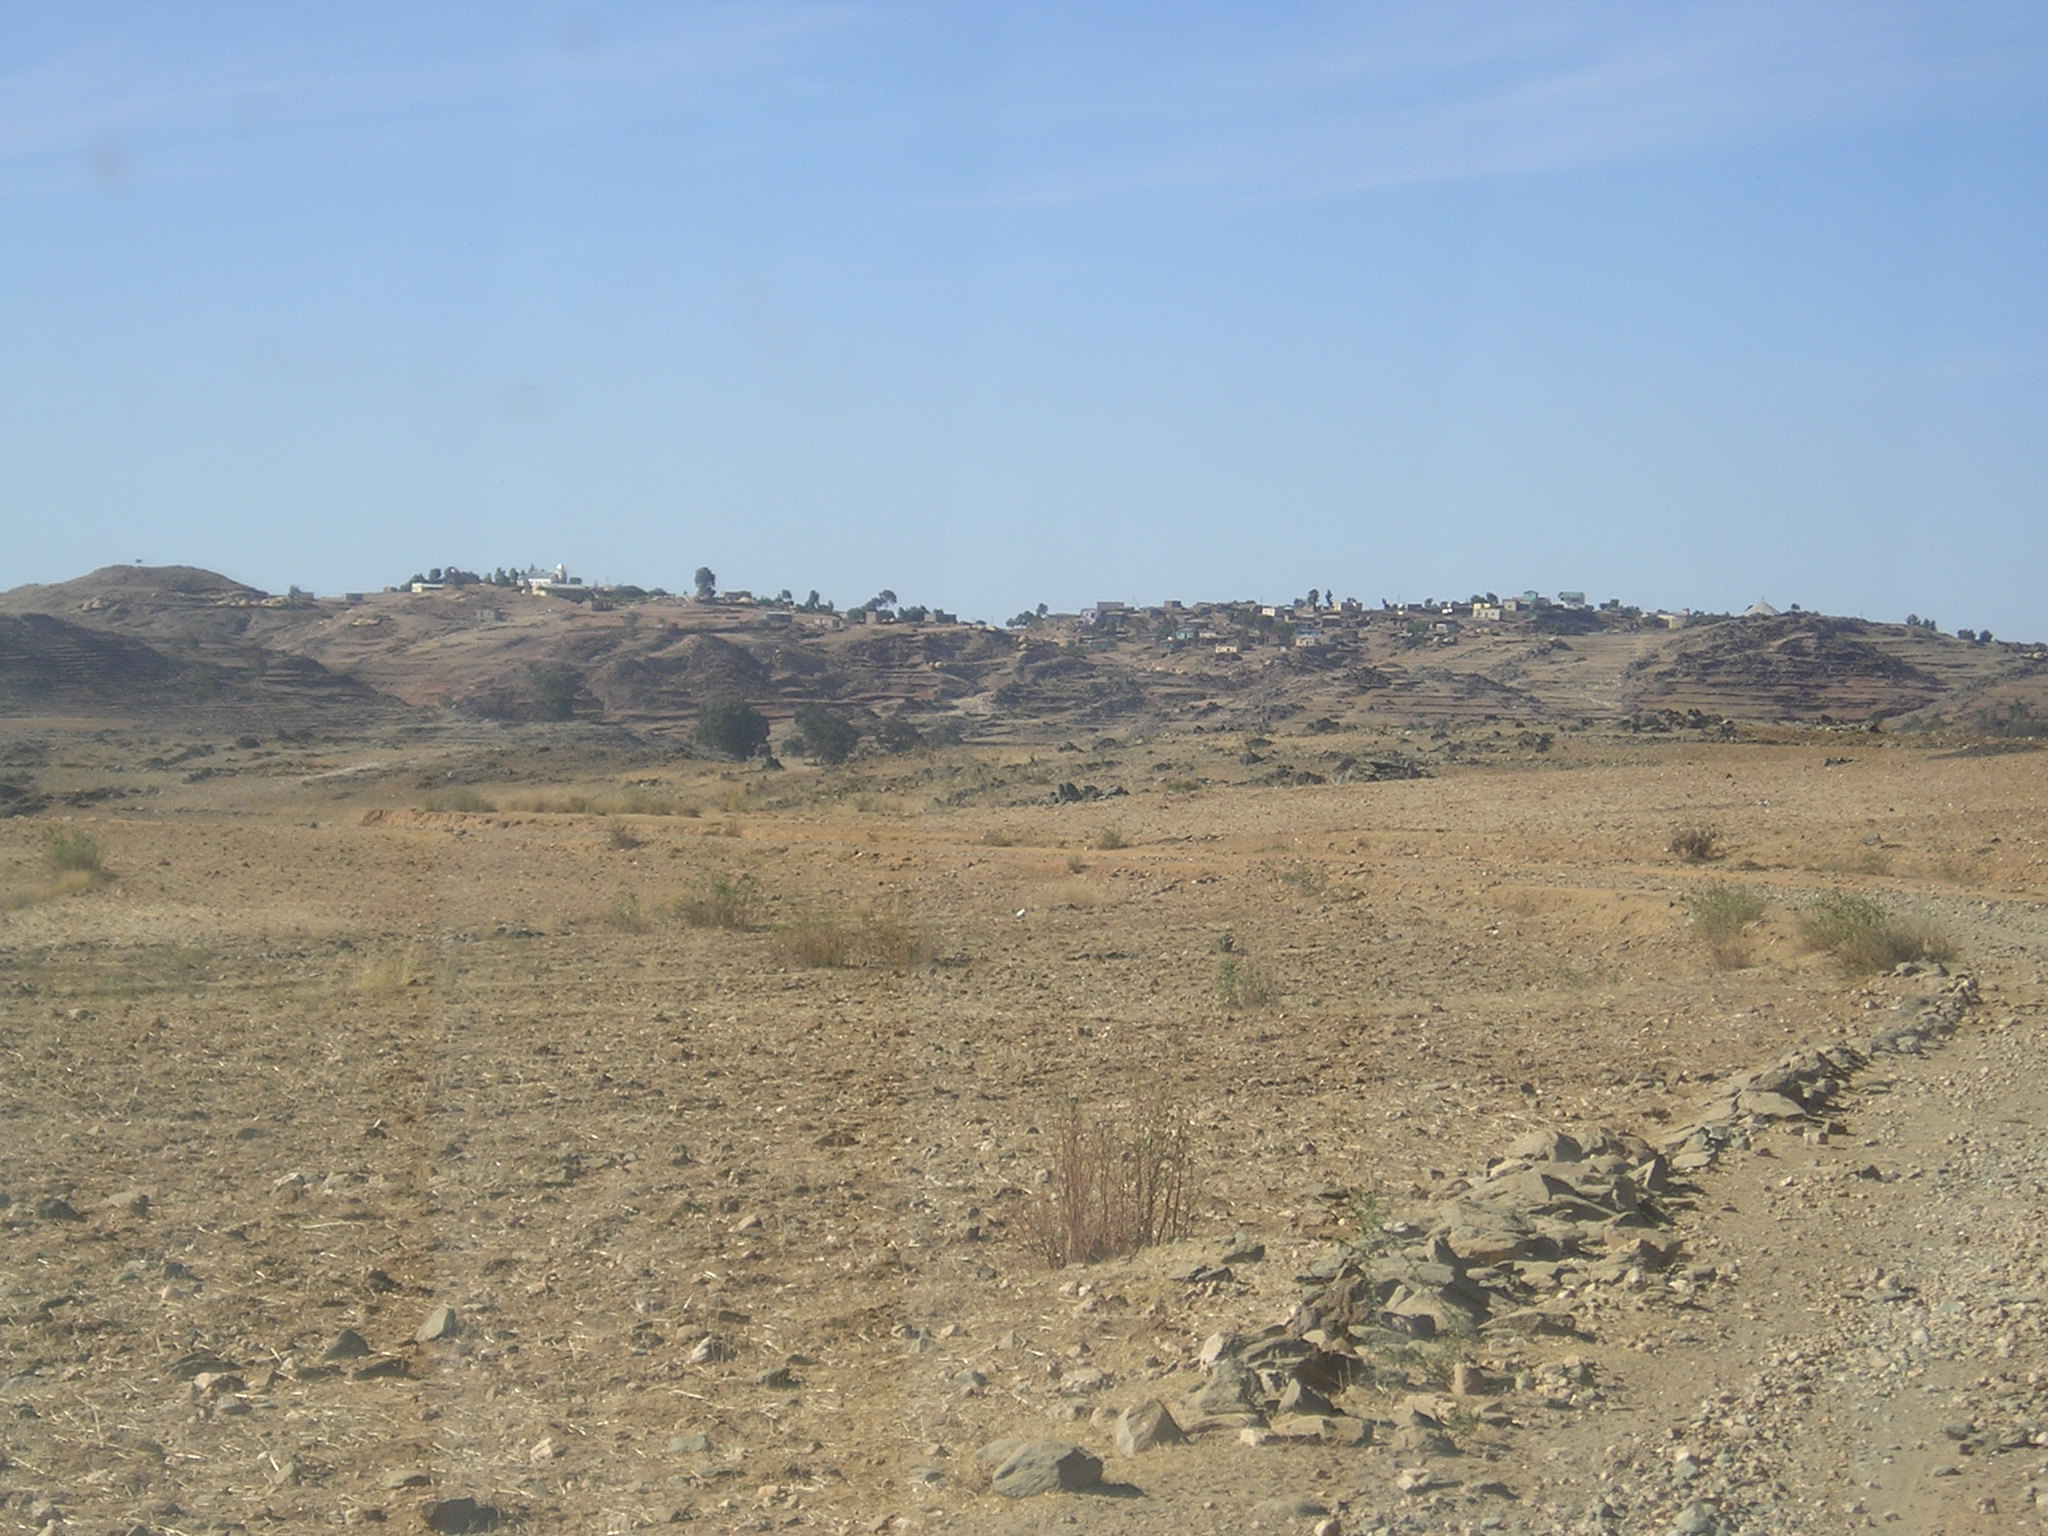
Hazega is a relatively small village with houses located on small hills surrounded by rocky farm land that is fallow during the dry season. A verification visit was made to hazega on December 30, 2003. During the visit, the local women community organizer related that 35 of a total of 125 planned installations was completed. EDOE staff divided into two groups and conducted a total 10 interviews. Interview activity was photo-documented for houses #1, and #3 with improved mogogos and houses #2, and #4 with unimproved mogogos. It was found that the verified carbon credits per stove in this village were fairly small due to the very high prevalence of dung for fuel.
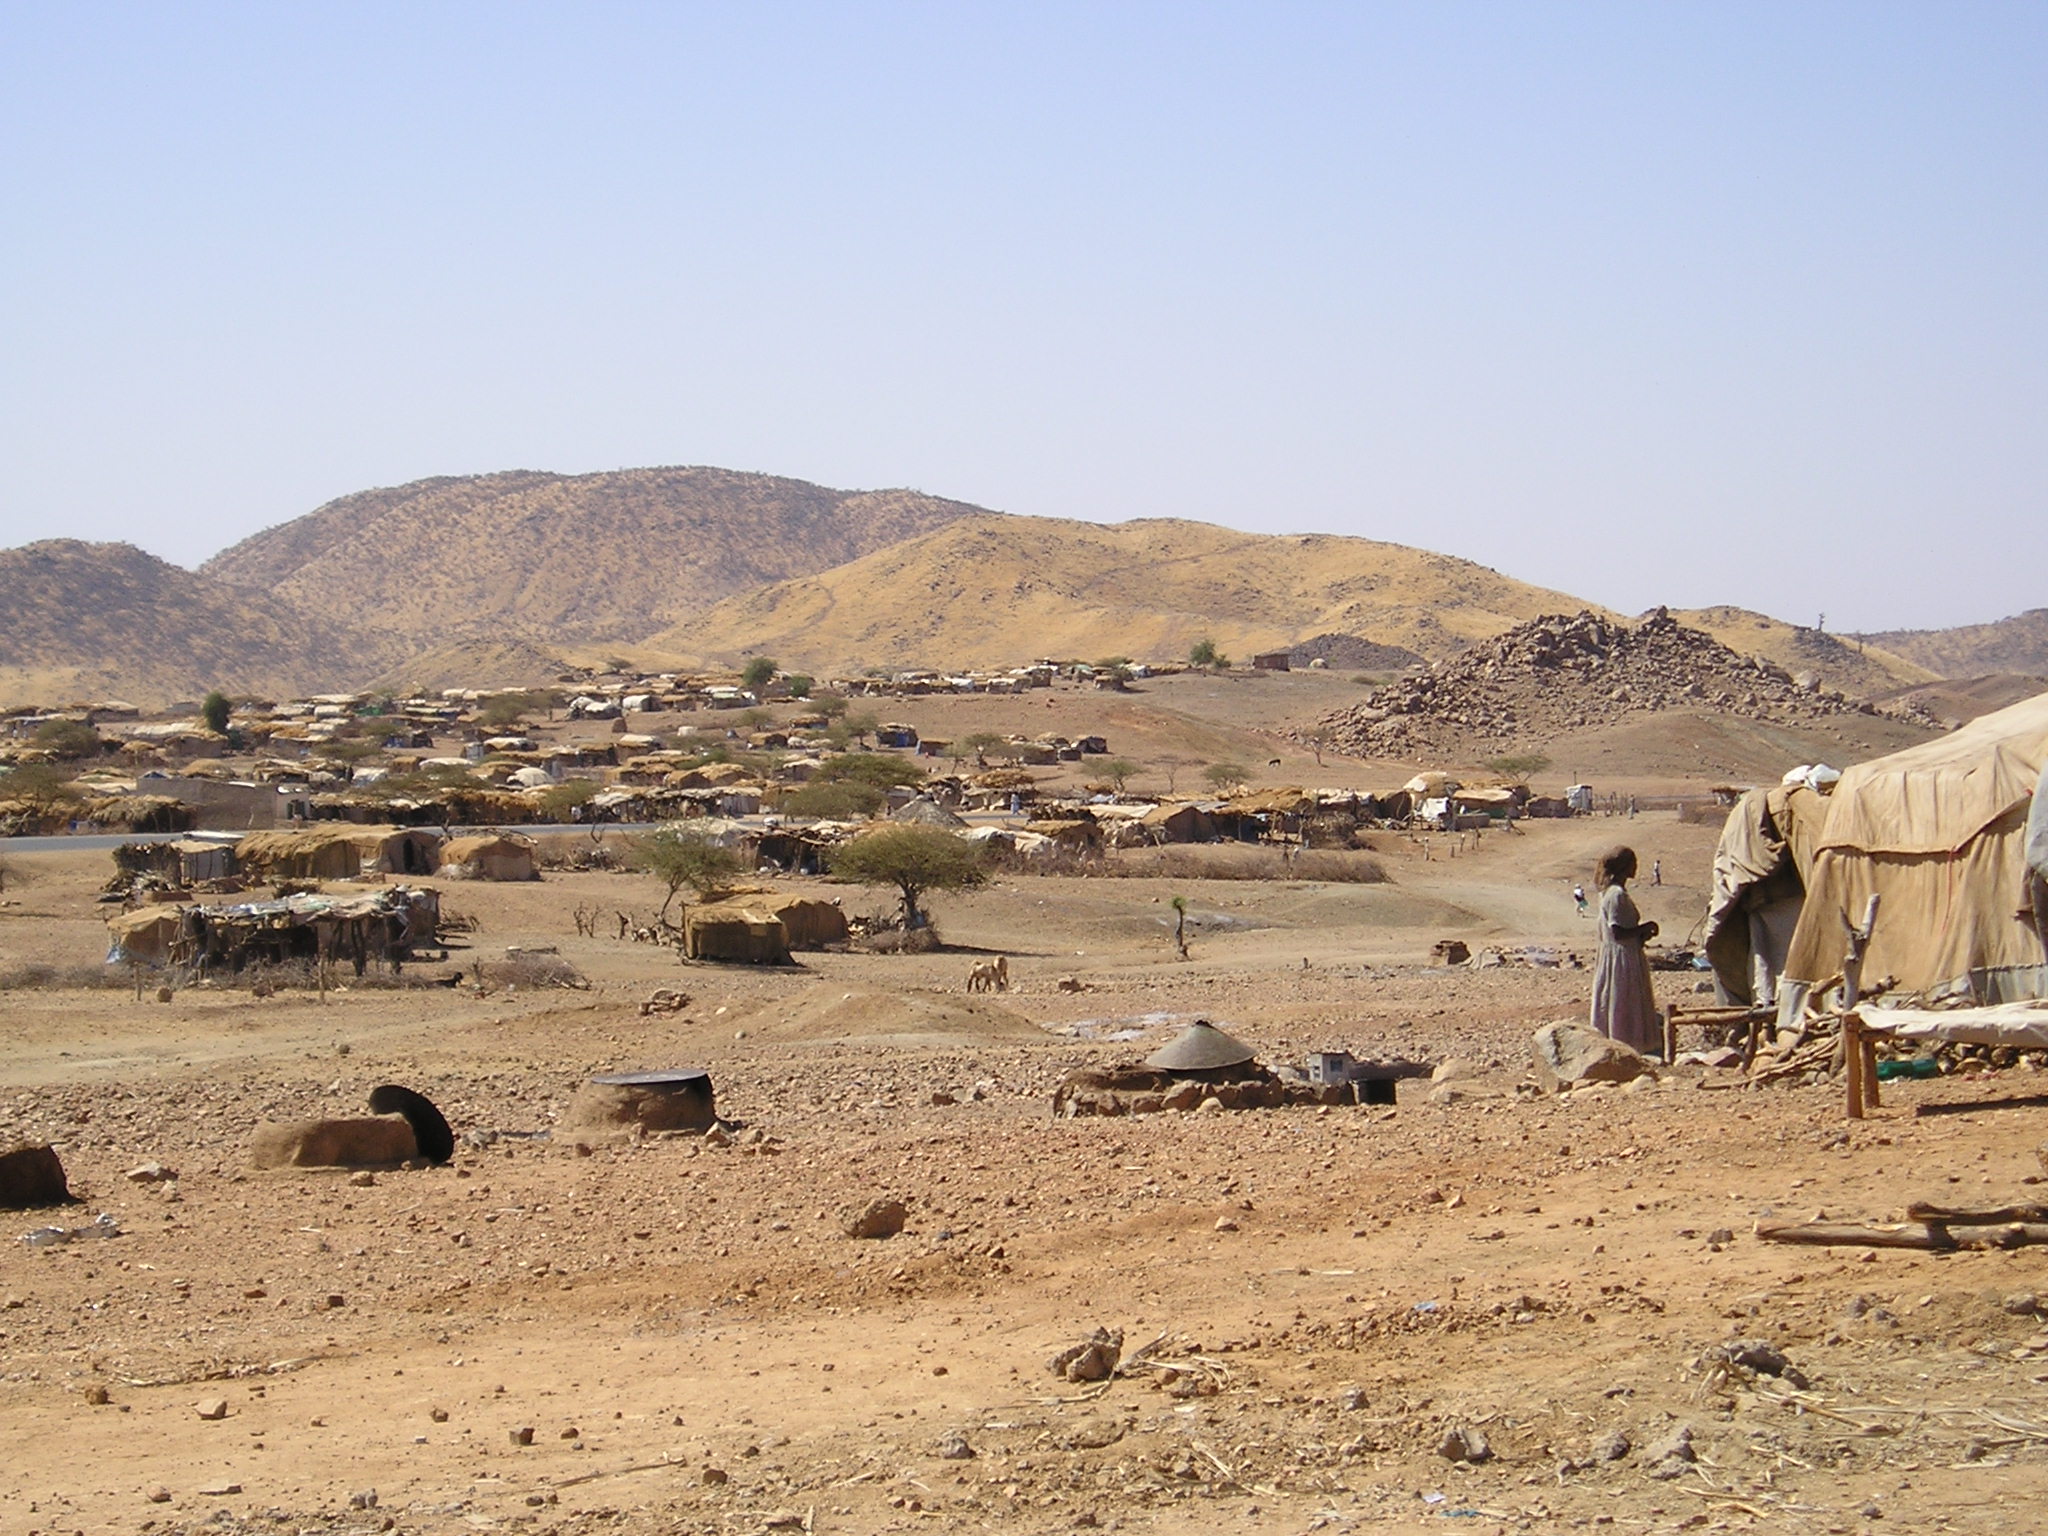
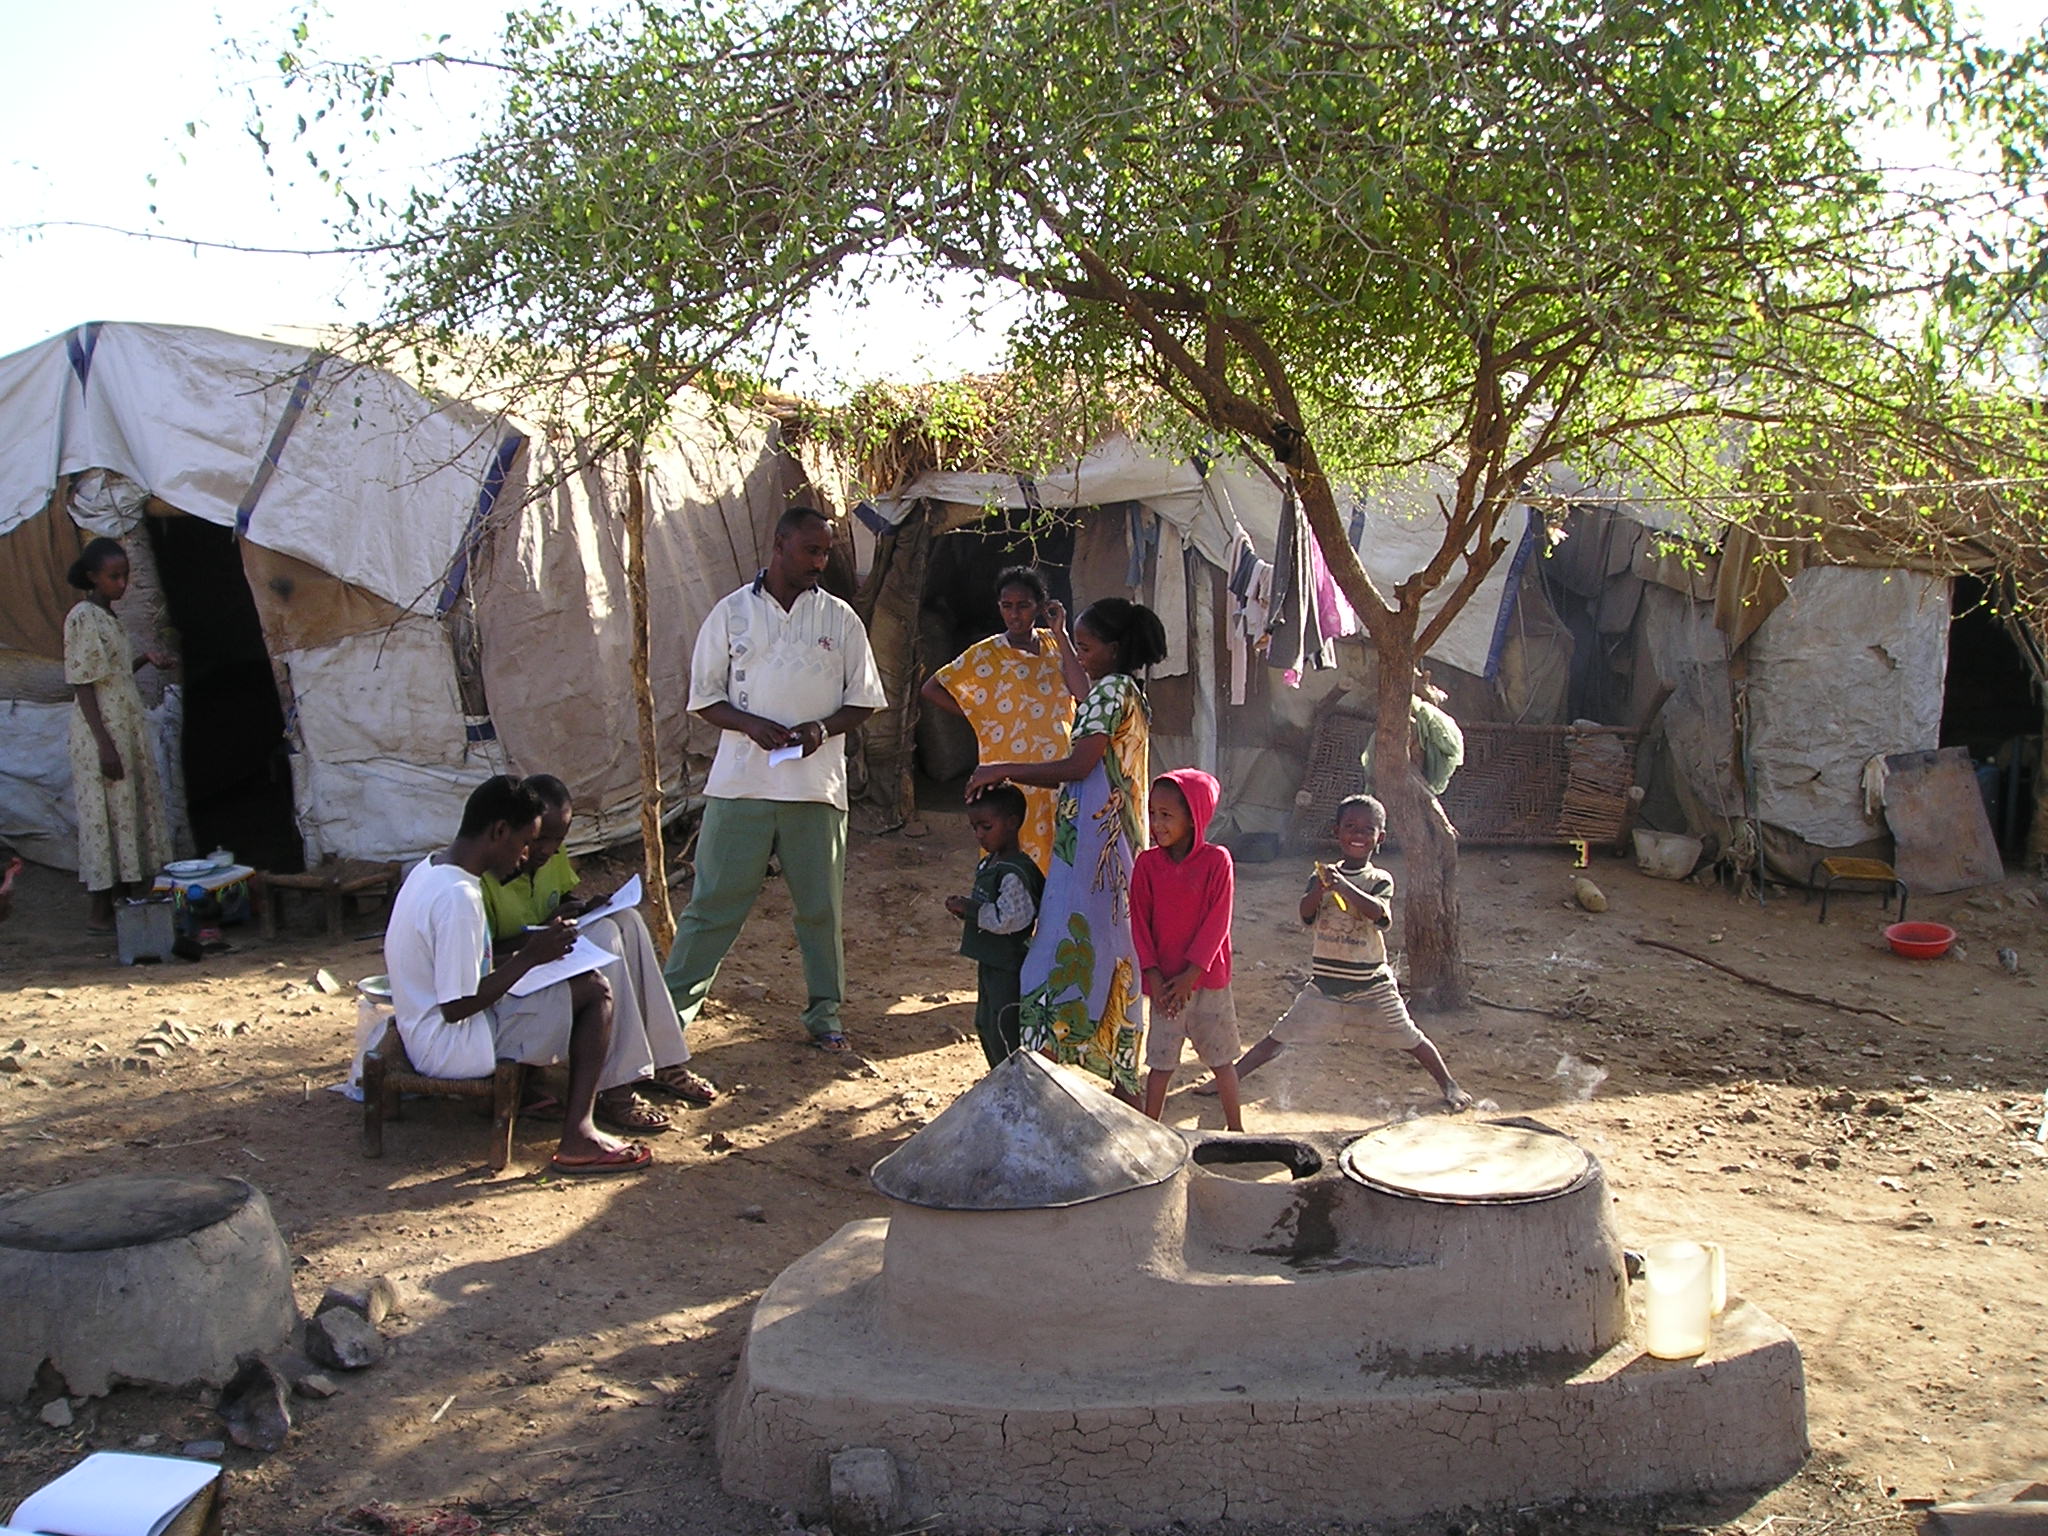
Adi qexi is a sprawling internally displaced persons (IDP) camp consisting of thousands of families. The renewed conflict between Eritrea and Ethiopia that started in May 1998 has resulted in the displacement of tens of thousands of families from who were living in the border region. Thousands of these families are currently housed in IDP camps supported by the International Committee of the Red Cross. One of the largest such camps is `adi qexi.
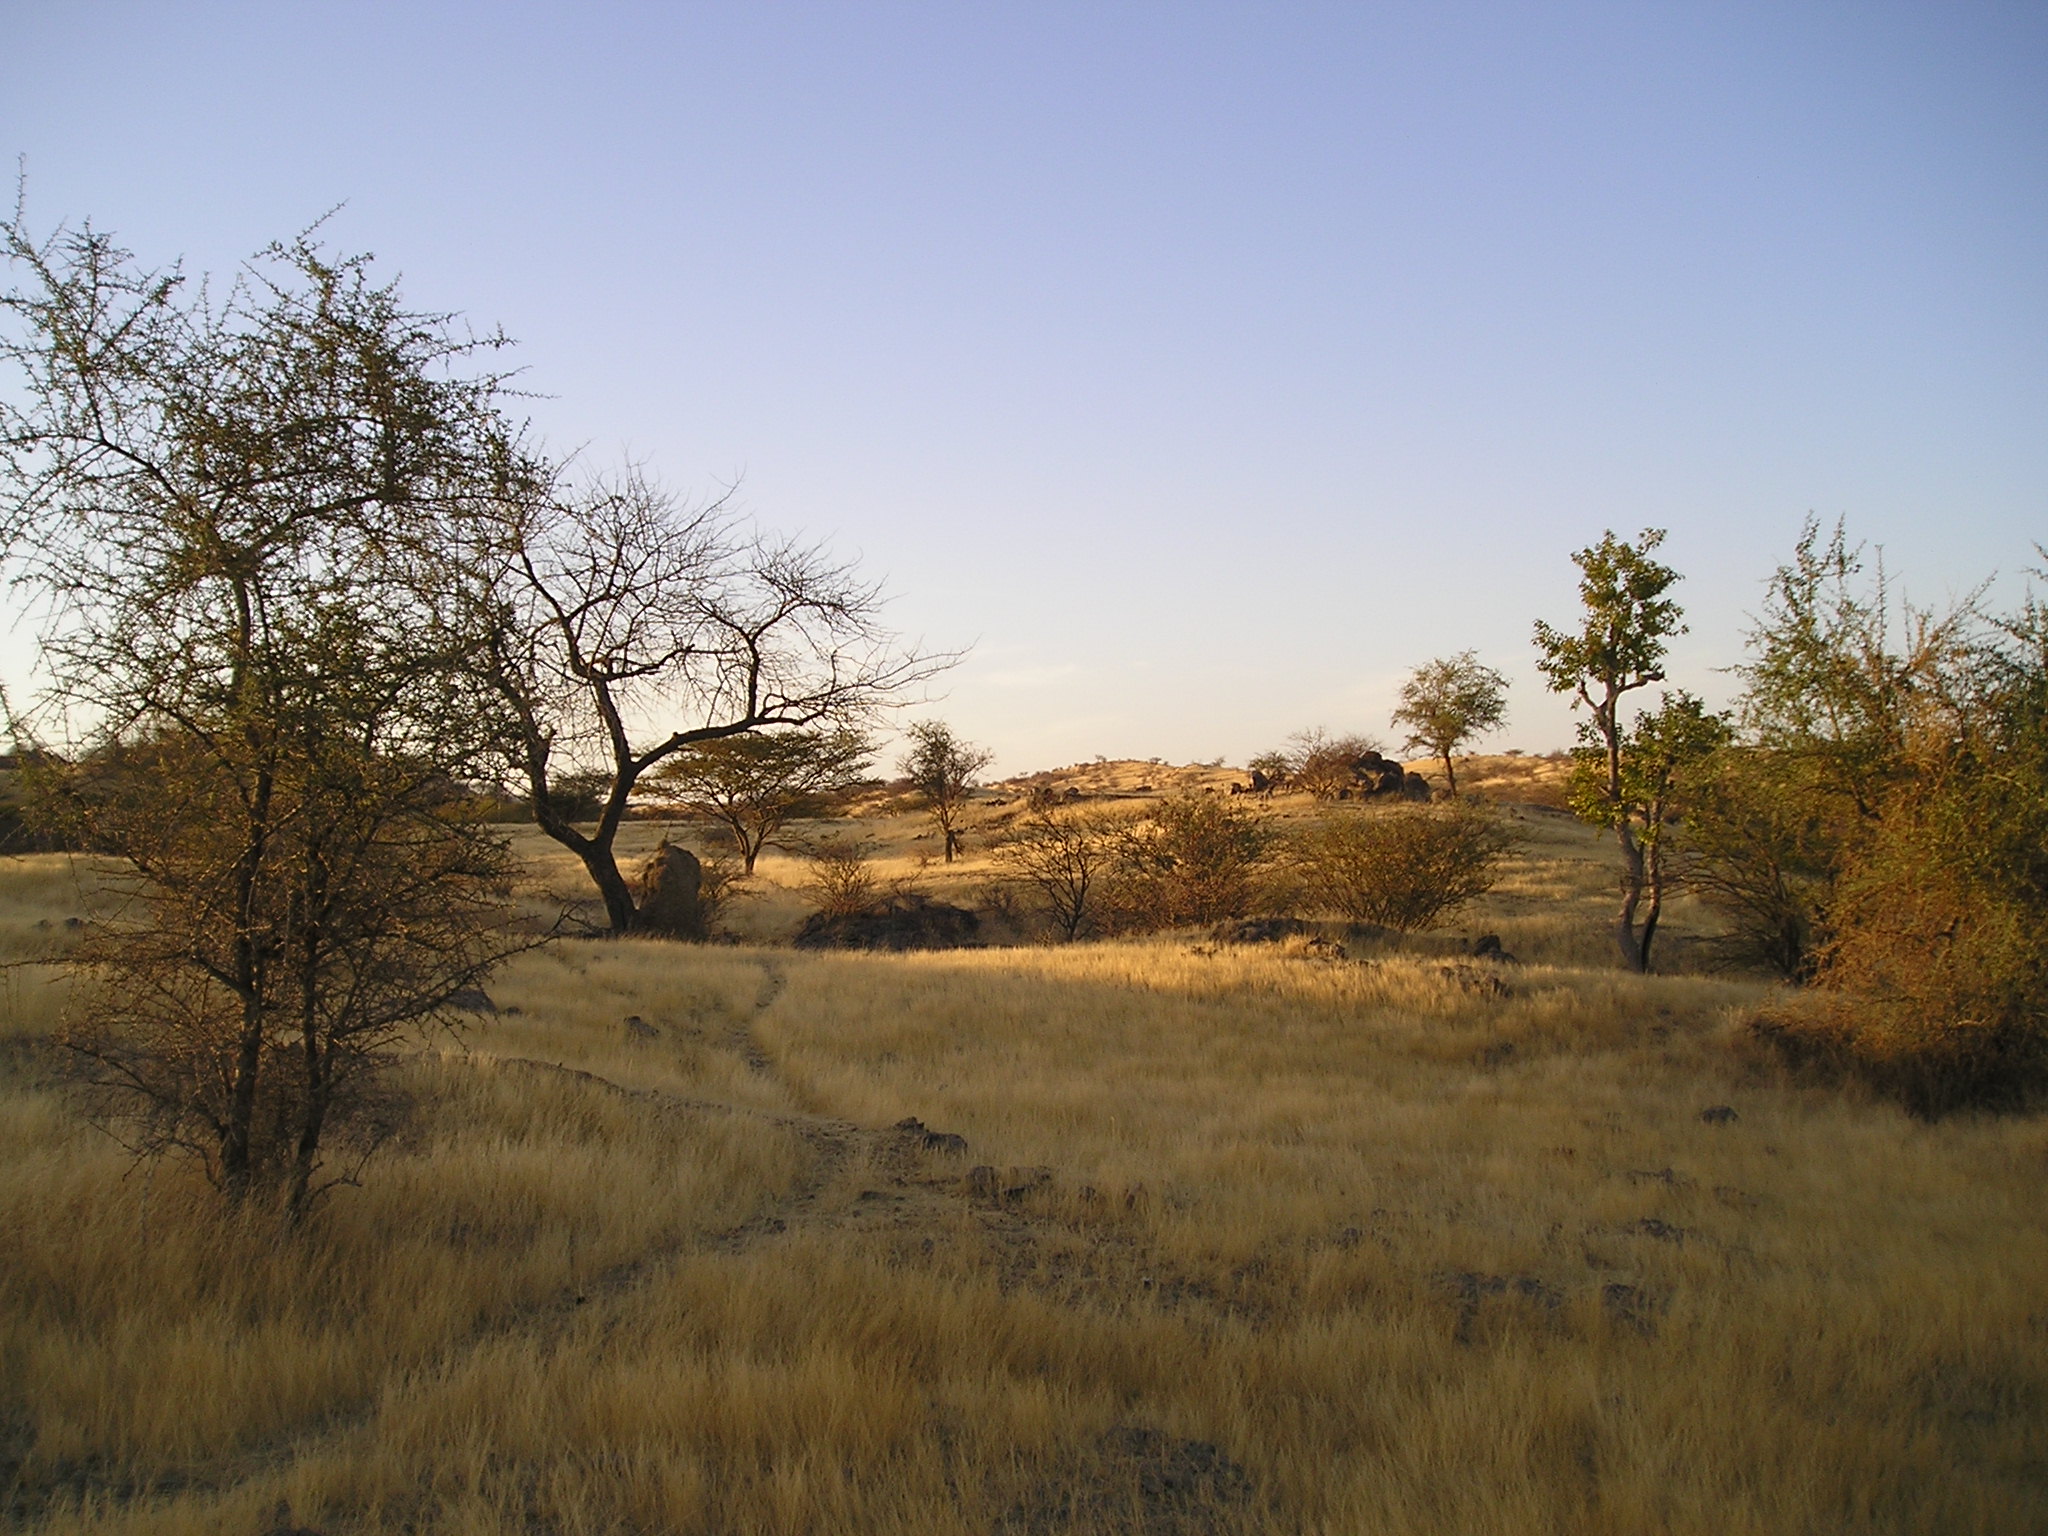
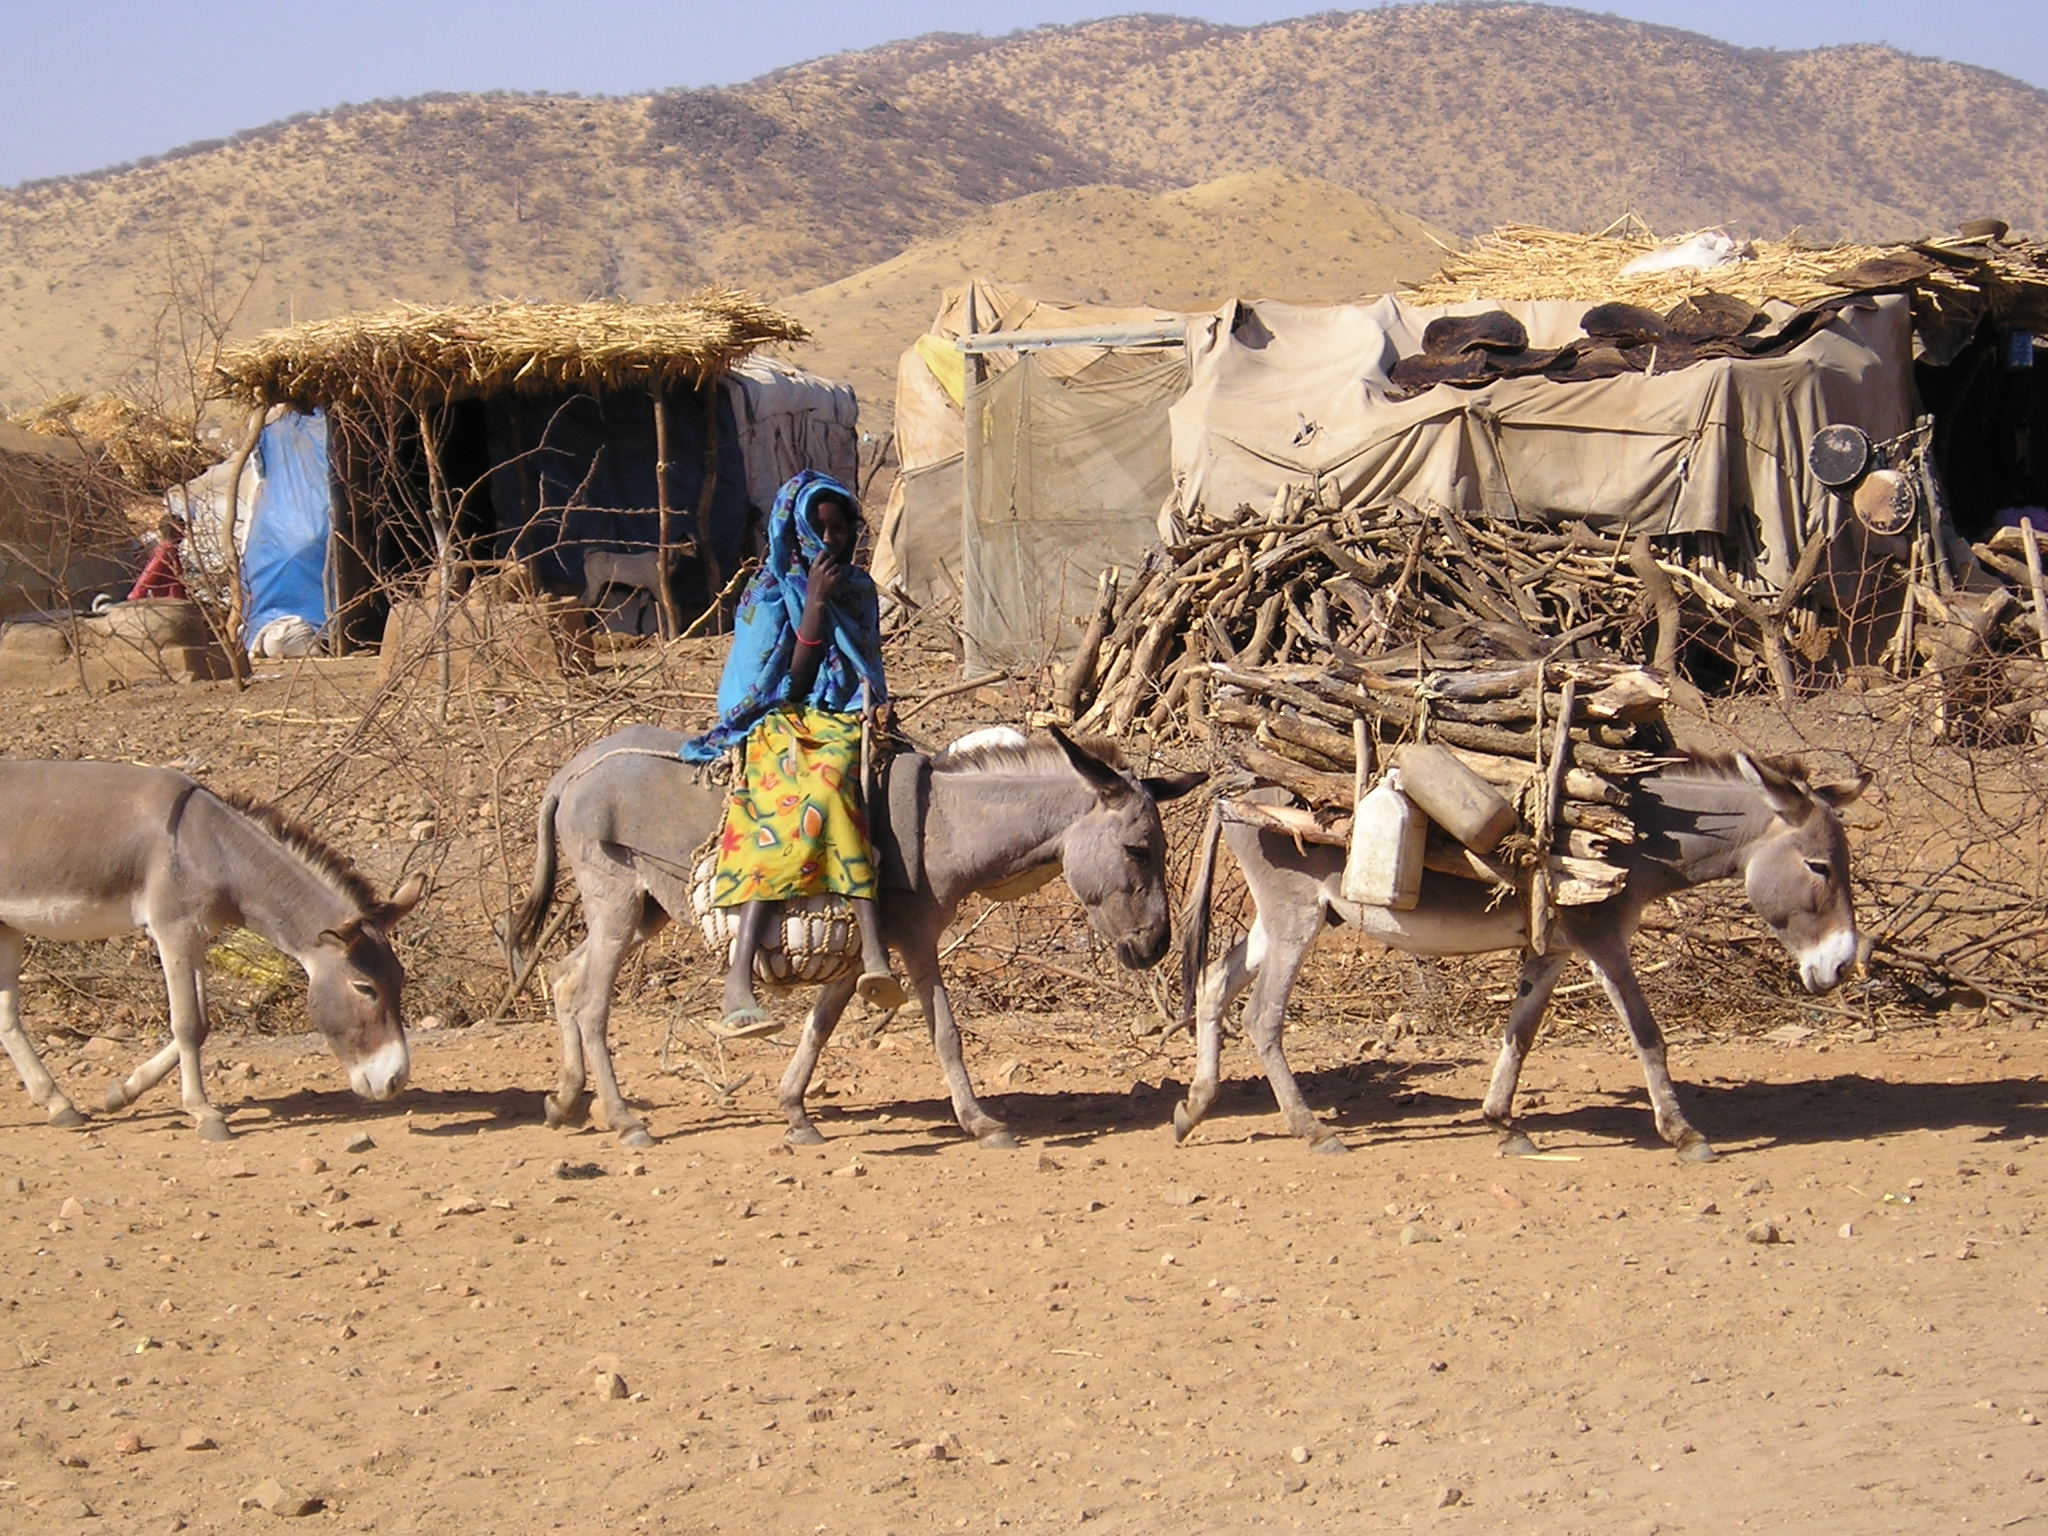
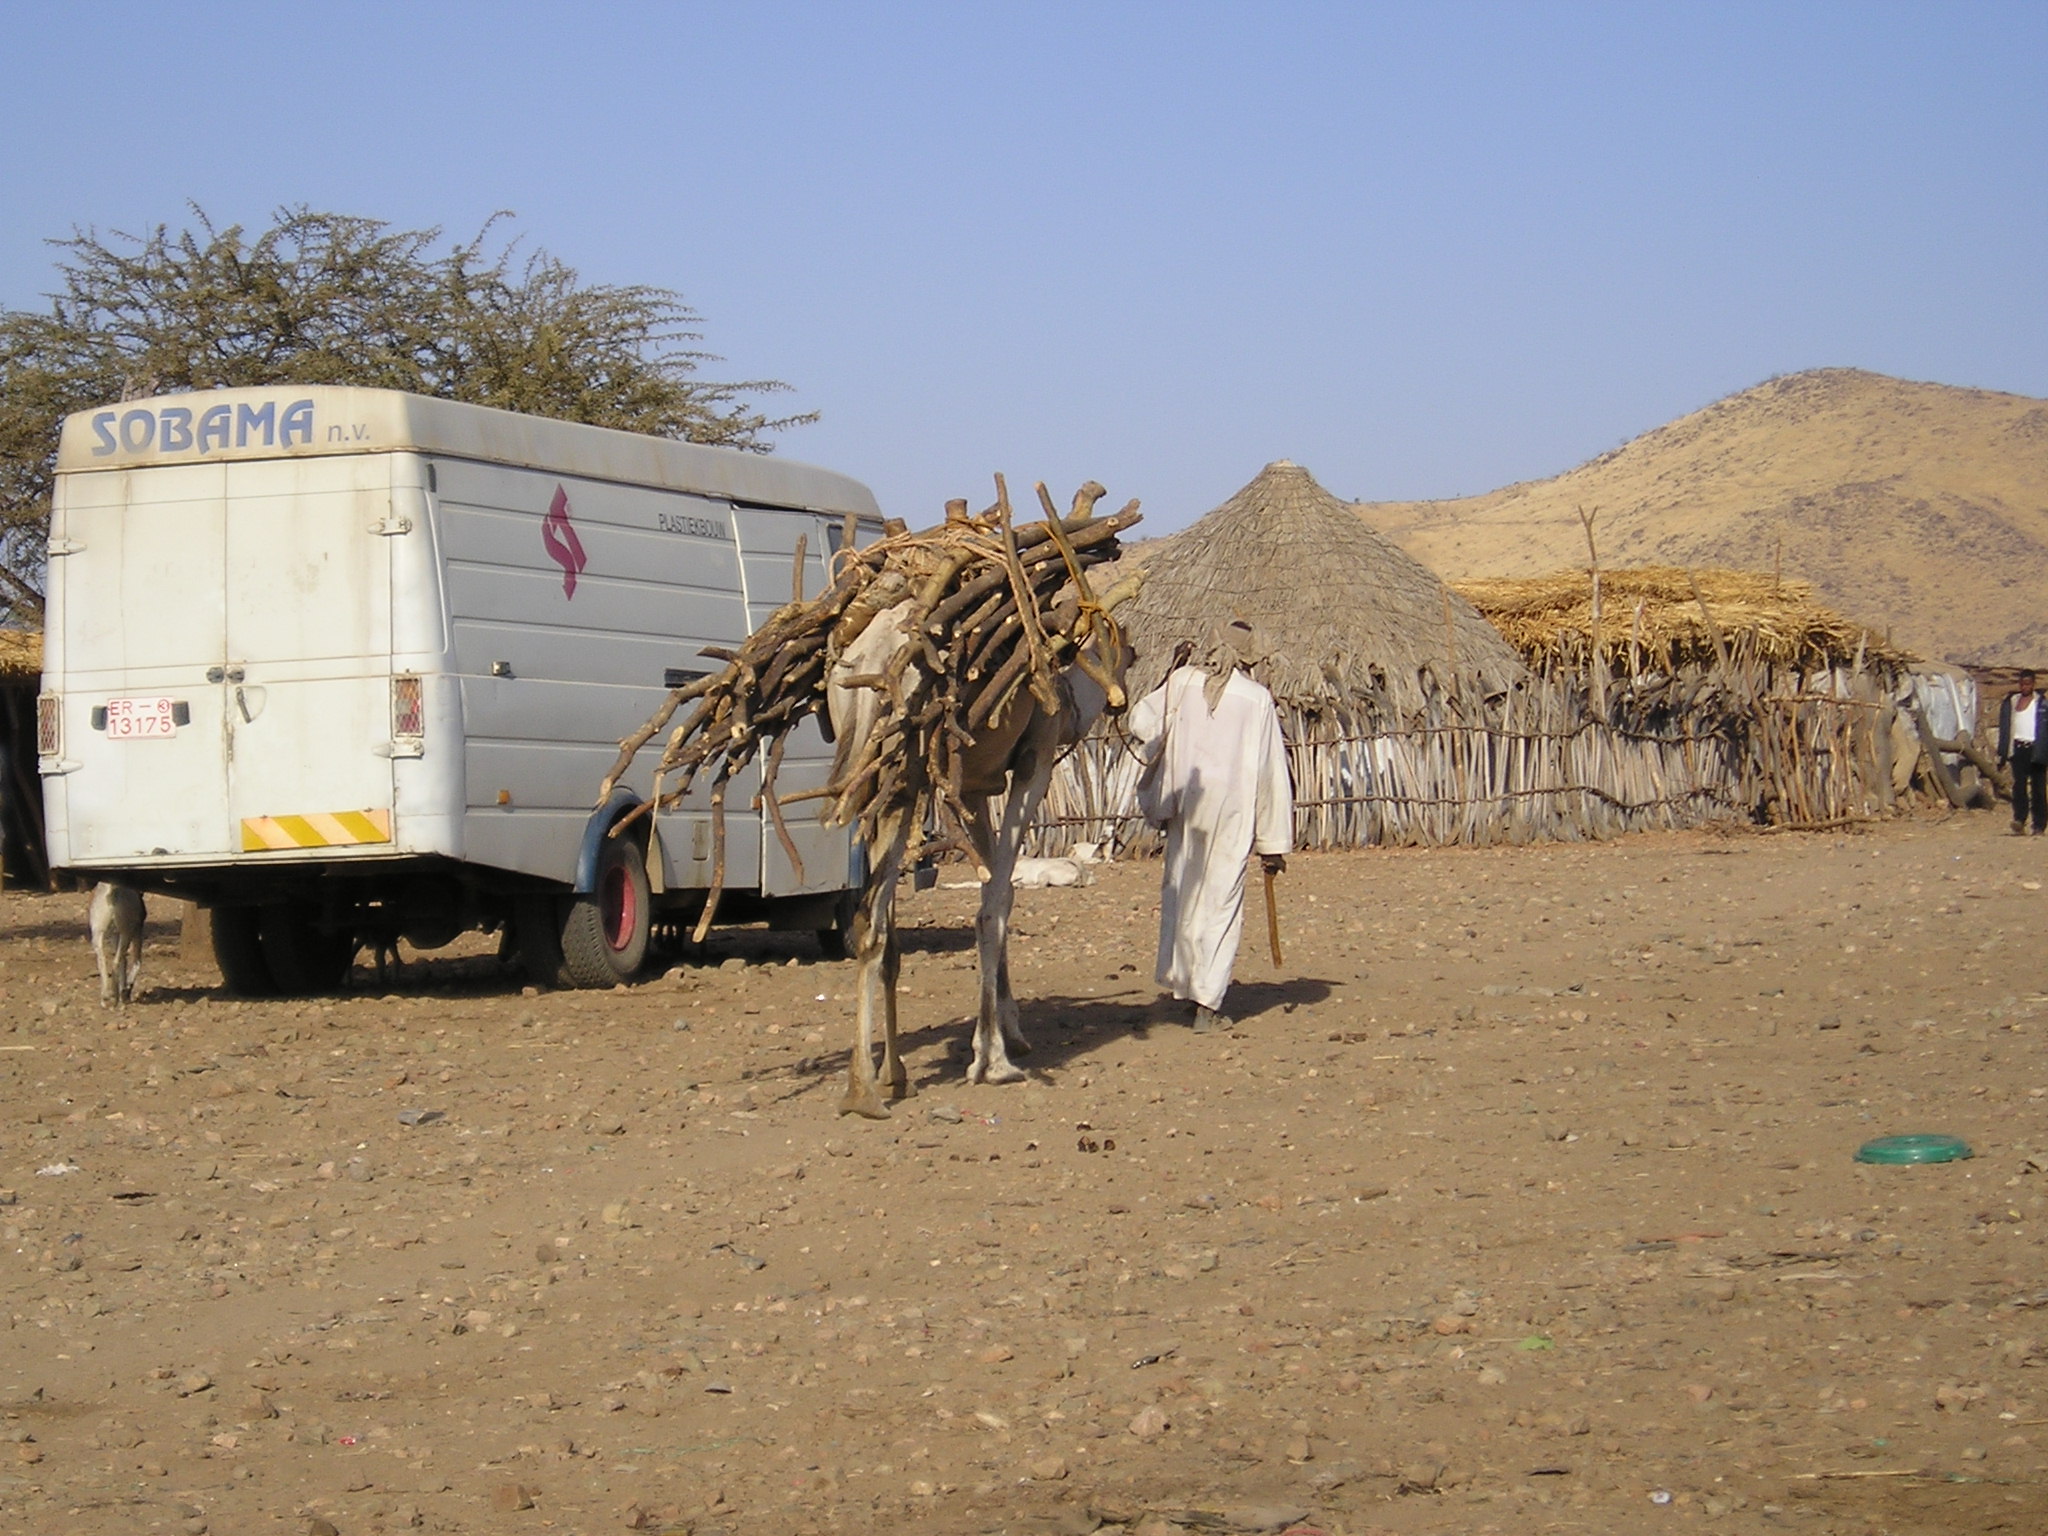
The natural landscape near `adi qexi is grass savannah dotted by acacia trees that becomes rather denuded near the camp so that wood collection can take over 8 hours because of long travel times to the nearest wood sources. The vast majority of camp members buy fuel wood from wood sellers who collect wood by the donkey load or camel load.
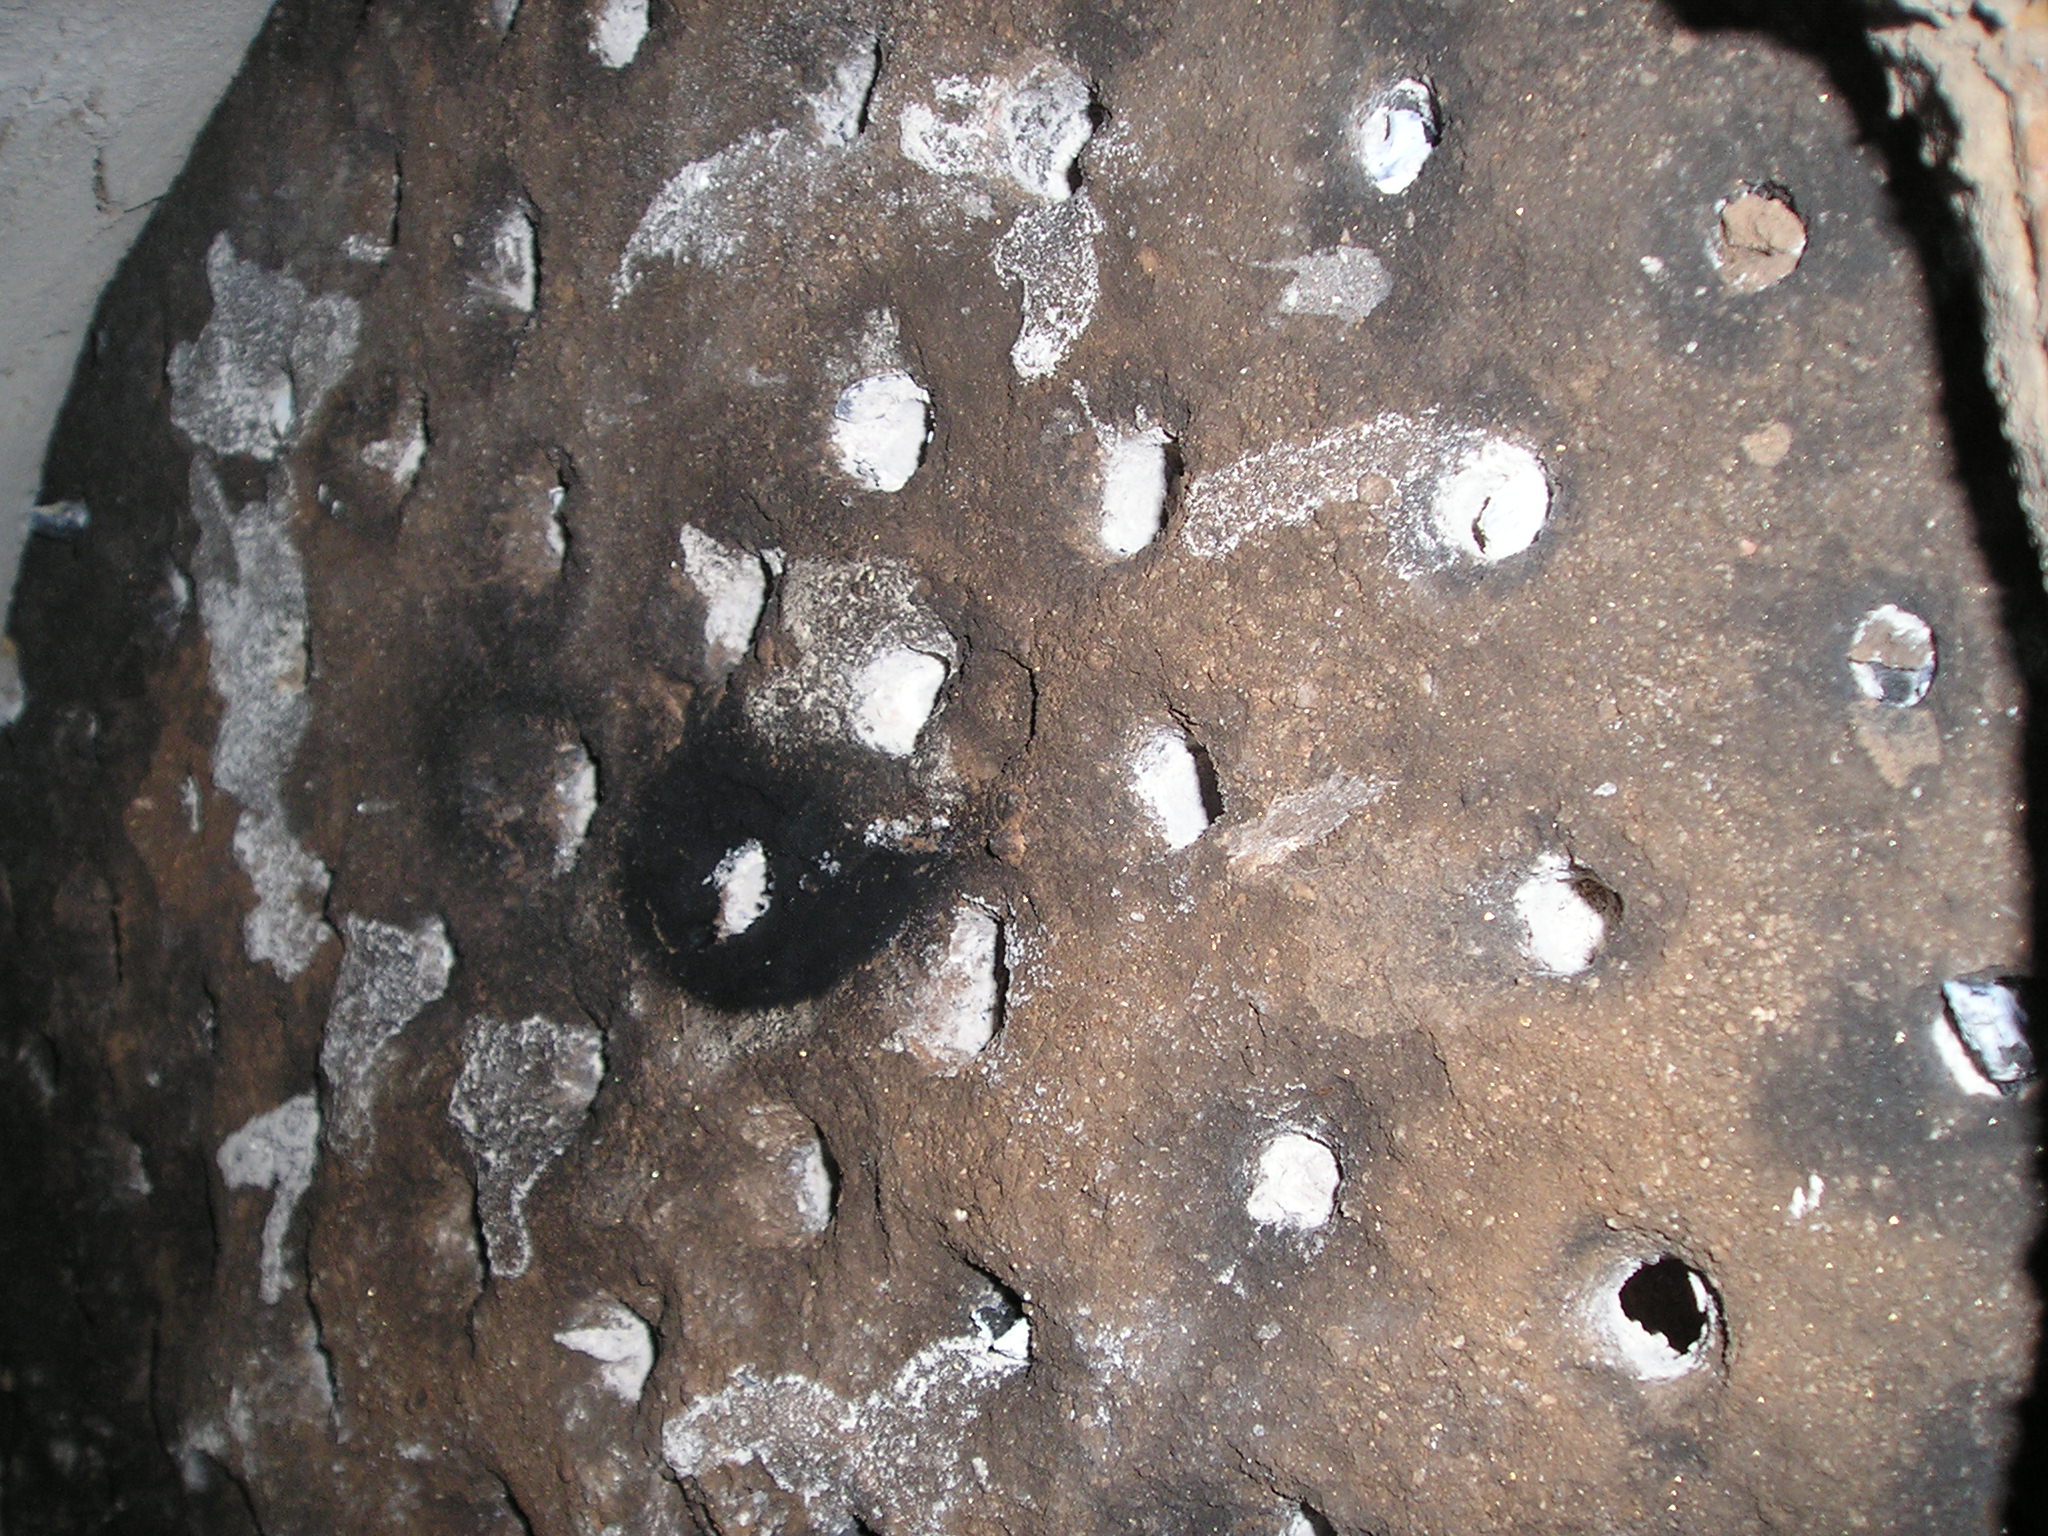
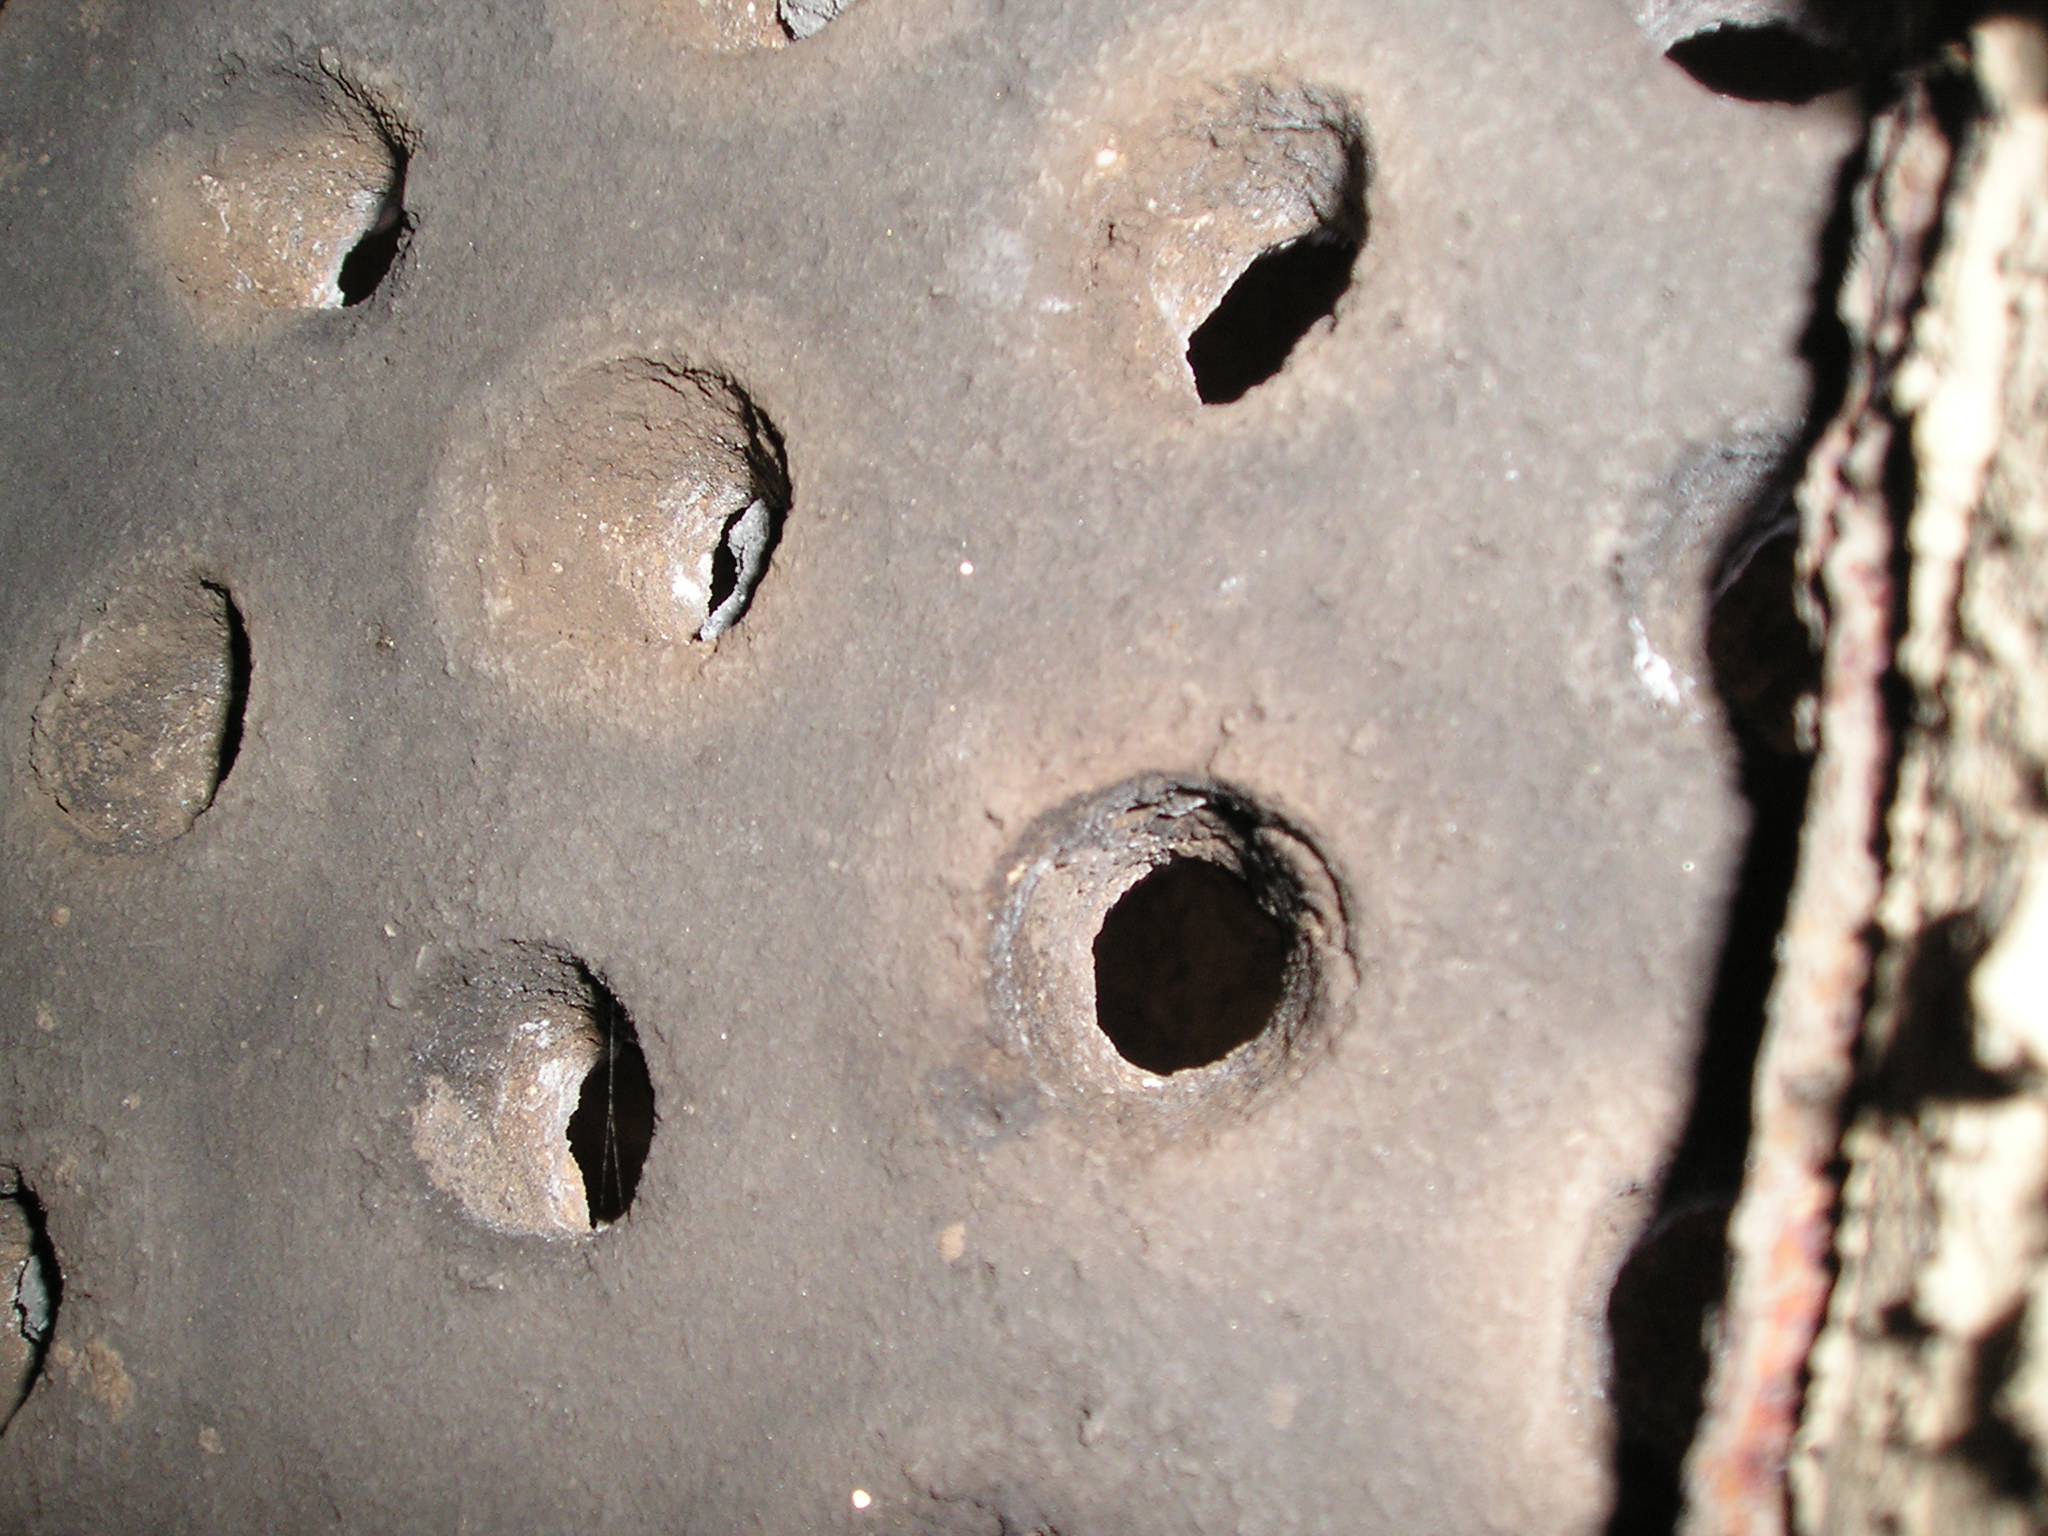
There were two rounds of interviews done in `adi qexi, one done by ICRC, and another done with a set of revised interview forms and more closely supervised by technical experts. The second, more careful round of interviews indicated subtantially smaller fuel savings than the earlier round of interviews, and revealed some stove installation problems. The key problem was that many of the grates where installed upside-down so that many of the holes were clogged with ash. This prevents air from flowing from underneath the fuel to increase combustion efficiency (one of the main advantages of the new design). But in spite of the problems, about half of the grates were installed correctly and free from clogging leading to substantial savings on average.
In the second round of interviews, a total of 23 households were interviewed with about half having the improved mogogo, and about half with the unimproved, traditional mogogo. Detailed demographic, cooking time, fuel consumption, and fuel collection data were collected. In addition some data was collected on the incidents of cough. The fuel consumption was about 15% less for households that tried to install the improved stoves, but was about 50% less for a small restaurant that likely installed the stove correctly and does not use kerosene to start the fire. Because the ICRC provides a free kerosene ration, nearly all households reported using kerosene to start the mogogo fire (a very uncommon activity in other areas). On average households with the improved mogogos reported about half as many family members with cough. The primary benefits of the stoves was reported to be both fuel economy and reduced smoke.
The detailed VER calculations are presented in an Excel spreadsheet ( MogogoData20040331.xls). The spreadsheet contains a summary sheet that provides the list of villages and relevant data for each village including the number of stoves, the VER's by vintage, average household sizes, bread cooking/consumption rates, stove types, and fuel use.
The survey data and VER calculations for each village are provided as individual spreadsheets that provide the data, average the survey data values over the interviewed households, and then calculate the CO2 emissions reductions based on the average survey values and the verified assumption that the improved stoves are about twice as efficient as the unimproved stoves. Details of the equations for calculating VER's is provided in appendix A below.
The VER estimation methodology is largely compliant with the methodology laid out in the EDISP project document. Some modifications have been made so that the VER estimate is easier to make given available data and resources. These modifications include:
The basic methodology for estimating CO2 emissions arising from cook-stove use starts with a per-capita emissions estimate. This is because per-capita consumption is likely to be more consistent than per-household consumption due to variations in household size. For the project, emissions are estimated at the village level by first multiplying the per-capita emissions times the average number of people per stove to obtain the per-stove savings and then multiplying the per stove savings to time the number of stoves to obtain the emissions reductions from the stove improvement program in a village.
There is a substantial amount of uncertainty in the estimation of CO2 emissions from cook-stove use. Because of this, the project will use possibly two methods for emissions estimates, based on two independent pieces of data that will be collected from village interviews. The first method estimates emissions from the starting point of per-capita food consumption. Then the factors that convert per-capita food consumption to energy, then to biomass, and then to CO2 emissions. The second method estimates CO2 emissions from the starting point of biomass fuel consumption. The advantage of the first method is that per-capita food consumption can be measured to greater accuracy than per-capita biomass consumption. The advantage of the second method is that fewer conversion factors are needed in order to estimate CO2 emissions from the measured data.
The first method for estimating CO2 emissions is described by the following equation:
where:
In this equation, the injera consumption per capita, InjC, and the fuel fraction, FuelFrac, are estimated from surveys in the project area. The energy intensity of injera production, EInj, is obtained from laboratory experiments and studies, that estimate energy intensity as a function of the final injera thickness or density. The Eritrean Department of Energy may use an average injera energy intensity, if this is not seen to vary substantially between households and villages.
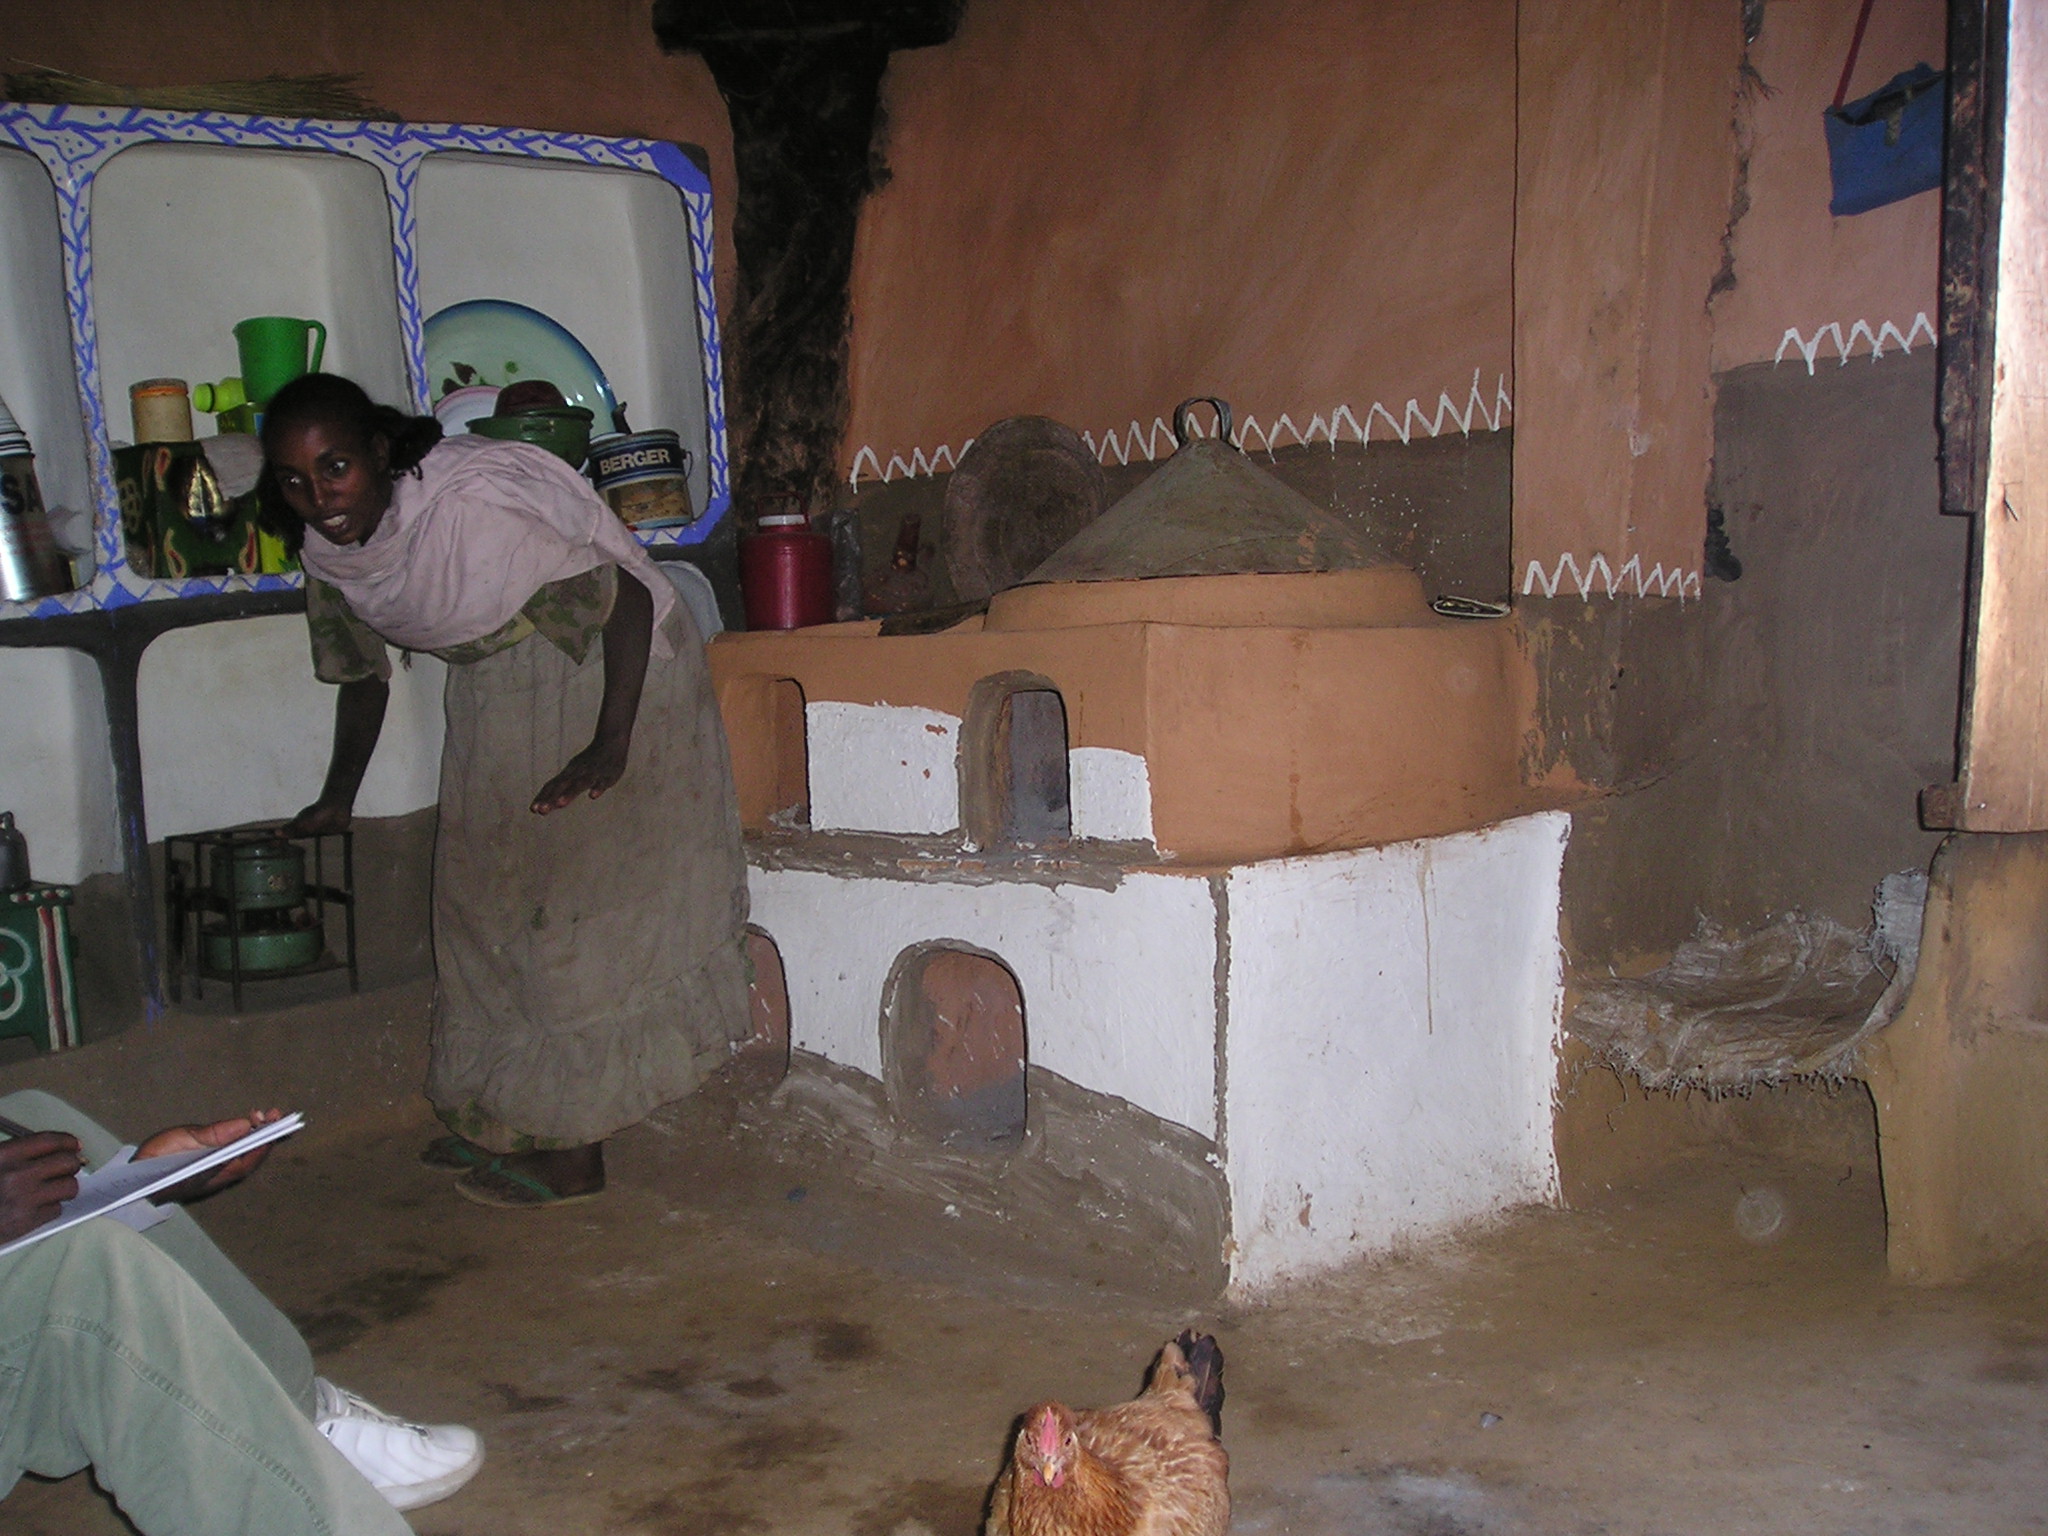
The efficiency of the cook-stove is a function of cook-stove type and features. With regards to firebox construction there are four types of cook-stoves:
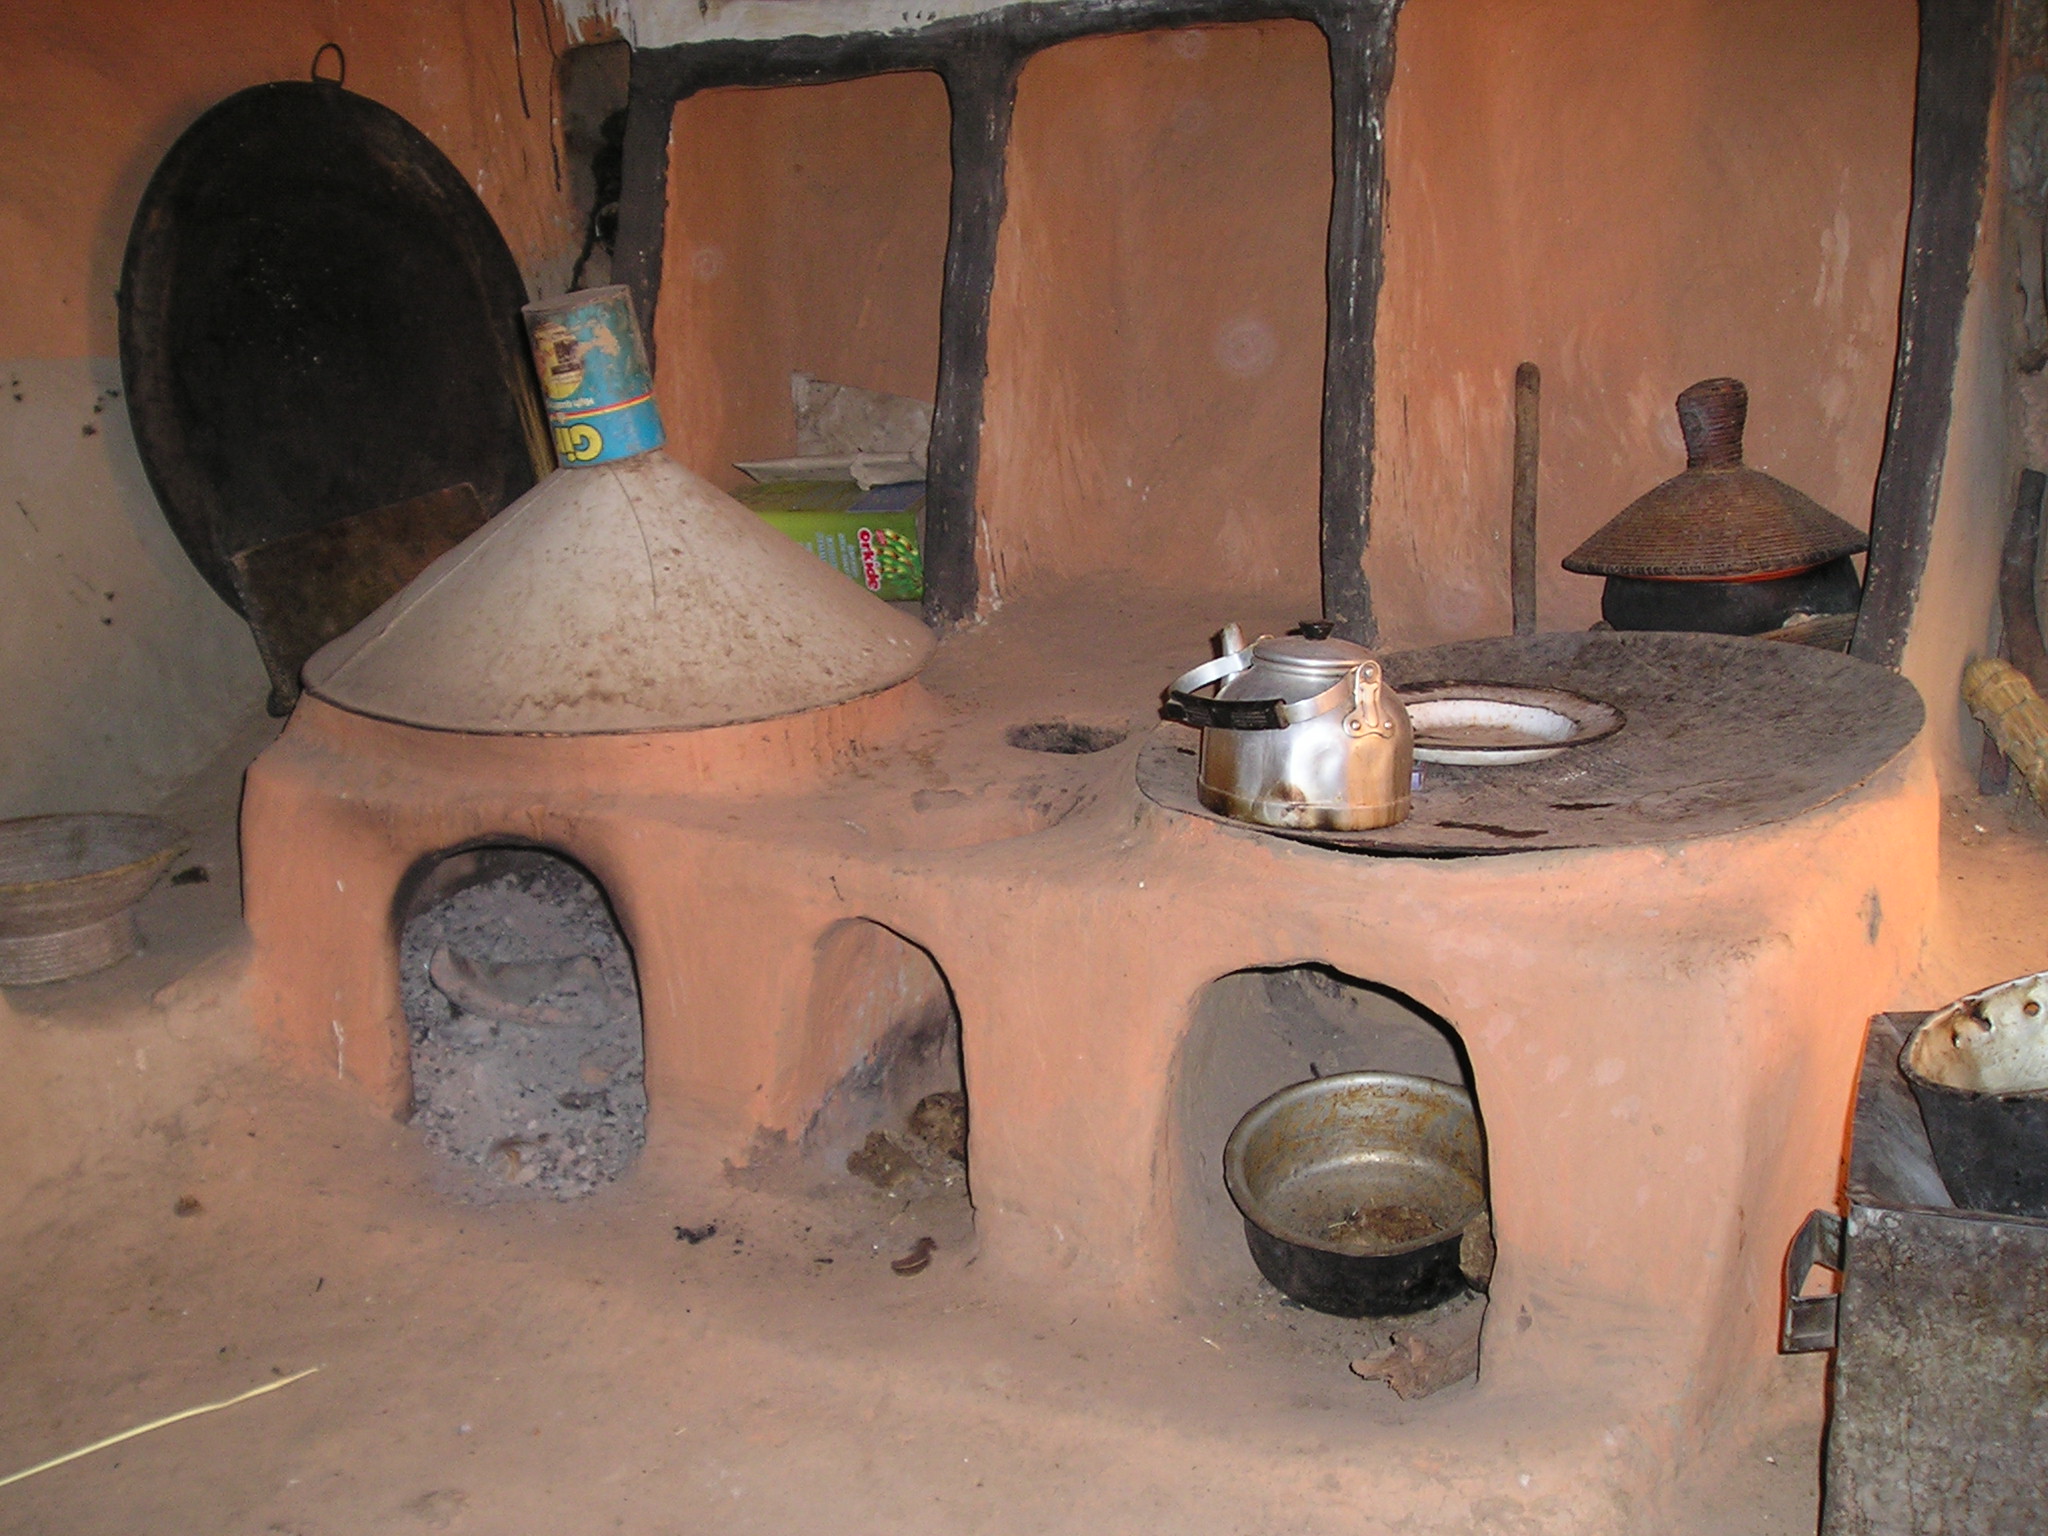
In addition, improved stoves may include only the mogogo, or they may include an integrated design of three stoves that includes a mogogo (for cooking taita or injera), a moqolo (for cooking qiCa), and a smaller in-build stove for cooking sauces.
Other features of the stoves may include whether or not the stove has a chimney (almost all improved stoves do), and whether the chimney has a control valve.
The efficiency of the different types of stoves (Eff) are performed using a combination of laboratory and field tests. Average values of efficiency are used that correspond to an average length of cooking session that produces between 15 to 20 injera.
The variables EBio, WetEff, BGBio, and CCont are derived from references in the international literature, as is the value of BLife for wood. An estimate of the value of EBio for dung is provided in an appendix of this report.
The total CO2 emissions are estimated as the sum of the per-capita CO2 emissions for each fuel type times the population.
Table A-1: Emissions Estimation Parameters for Method #1
| Parameter | Low | Medium | High | Selected | Source |
| FracPerm | 80% | 90% | 100% | 90% | Estimated |
| FuelFrac Dung Wood |
100% 0% |
60% 40% |
0% 100% |
60% 40% |
2001 Study |
| InjC | 70 kg/year | 130 kg/year | 180 kg/year | 130 kg/year | 2001 Study |
| EInj | 0.8 MJ/kg | 1.4 MJ/kg | 2.0 MJ/kg | 1.4 MJ/kg | 1996 Study |
| Eff
Old Field Old Lab New A New B New C |
7% 10% 18% 23% 26% |
10% Base 20% Project |
Field Measurement 1998 Study 1998 Measurement Estimated 2000 Measurement |
||
| EBio Dung Wood |
12.0 MJ/kg 16.6 MJ/kg |
12.0 MJ/kg 16.6 MJ/kg |
IPCC 1996 IPCC 1996 |
||
| BLife Dung Wood |
5.0 years |
1.0 years 9.4 years |
13.7 years |
1.0 years 9.4 years |
Estimated IPCC 1996 |
| WetEff | 70% | 90% | 100% | 100% | Estmated |
| BGBio | 0.23 | 0.47 | 0.85 | 0.47 | IPCC 1996 |
| CCont | 1.6 | 1.8 | 2.1 | 1.8 | IPCC 19962 |
The second method for estimating CO2 emissions is described by the following equation:
where:
In this equation, the biomass consumption per capita, Biomass, for a particular fuel type are estimated from surveys in the project area. Ideally such surveys would be conducted both before and after the improved stove project is implemented. If this is not possible then the biomass consumption for one case will be estimated from the biomass consumption from the other case with the following formula:
Biomass1 = Biomass2 * Eff2/Eff1The efficiency of the cook-stove is a function of cook-stove type and stove features as described above in the first emissions estimation method.
The variables WCont, BGBio, and CCont are derived from references in the international literature, as is the value of BLife for wood. An estimate of the value of BLife for dung is provided in an appendix of this report.The total CO2 emissions are estimated as the sum of the per-capita CO2 emissions for each fuel type times the population.
Table A-2: Emissions Estimation Parameters for Method #2| Parameter | Low | Medium | High | Selected | Source |
| FracPerm | 80% | 90% | 100% | 90% | Estimated |
| Biomass Dung Wood |
To Be Measured |
||||
| WCont | 20% | 10% | 0% | 15% | Estimated |
| BLife Dung Wood |
5.0 years |
1.0 years 9.4 years |
13.7 years |
1.0 years 9.4 years |
Estimated IPCC 1996 |
| BGBio | 0.23 | 0.47 | 0.85 | 0.47 | IPCC 1996 |
| CCont | 1.6 | 1.8 | 2.1 | 1.8 | IPCC 1996 |
A preliminary estimate of baseline emissions is provided here using data from the above tables and data received from a recent project test survey `adi nefas. The first estimate is obtained using the first method based on per-capita injera consumption:
This calculation yeilds a baseline estimate of per-capita CO2 emissions from injera cooking as 1199 kg/capita.
Using the second method which is based on surveys of fuel use, we obtain the following estimate of per-capita CO2 emissions:
This calculation using the second method yeilds a baseline estimate of per-capita CO2 emissions from injera cooking as 1370 kg/capita.
The two methods yield quite similar results with the second method providing a slightly higher estimate than the first.
In the VER calculations, it is generally assumed that the unimproved stoves use about twice the amount of fuel as the improved stoves. The per-capita fuel consumption is then multiplied by the average number of people in the household to estimate the per-stove VER's provided in Table 1 of this report. The values of VER per stove vary from about 1 tonnes to over 4 tonnes per stove, largely due to changes in the types of fuel used by households.
A key parameter in the estimate of CO2 emissions impacts from reduced biomass fuel consumption is BLife, the ratio of the annual consumption rate to the biomass stocks. The unit of this parameter is years. In this appendix, we estimate this parameter using data from Volume 3 of the Revised 1996 IPCC Guidelines for National Greenhouse Gas Inventories: the Greenhouse Gas Inventory Reference Manual.
In section 5 of the Greenhouse Gas Inventory Reference Manual on Land-Use Change & Forestry, estimates of annual average aboveground biomass update by natural regeneration are provided in table 5-2. We select for Eritrea, the dry forest regeneration rate for Africa for the first 20 years of regeneration as the figure that is most relevant to Eritrea biomass harvesting. The dry-forest regeneration rate is 4.0 tonnes/ha.
In table 5-4, total aboveground biomass is provided for different forest types for different African countries. We select as most relevant to Eritrea, the dry forest type which is estimated to have average aboveground biomass of 20-55 tonnes/ha. We select the median value of 37.5 tonnes/ha for Eritrea. This provides an estimate for BLife of 37.5/4.0 = 9.4 years.
Below we provide a fairly complete list of all EDISP villages with the approximate actual or planned beginning and endi dates of the project in each village, the number of stoves installed (or planned) and the VER's estimated for the village when available.
Table 2: List of Total EDISP Villages| Village Name | Begin Date | End Date | Stoves Installed | Stoves Planned | VERs | Notes |
| damba (phase 1) | 10/1999 | 12/1999 | 381 | 762 | ||
| damba (phase 2) | 12/2001 | 11/2002 | 70 | 144 | ||
| Se`Ida krstyan | 12/1999 | 12/2002 | 460 | 505 | ||
| `adi gerd | 1/2002 | 6/2001 | 100 | |||
| temajila | 1/2002 | 6/2001 | 100 | |||
| Halibmentel | 1/2002 | 6/2001 | 200 | |||
| `adi qexi barka | 1/2002 | 6/2001 | 60 | |||
| serejeQa kebabi | 1/2002 | 6/2001 | 56 | |||
| weki dba | 1/2002 | 6/2001 | 328 | |||
| tKul | 3/2001 | 4/2003 | 209 | |||
| wuTuH | 1/2001 | 6/2001 | 131 | |||
| maylbus | 4/2001 | 6/2002 | 170 | |||
| `adi tekelEzan | 6/2001 | 12/2002 | 150 | |||
| quxet | 8/2001 | 9/2002 | ||||
| `adi xmagle | 6/2001 | 9/2002 | 30 | |||
| `adi habslus | 6/2001 | 9/2002 | 45 | |||
| Se`azega (phase 1) | 3/2001 | 6/2002 | 200 | |||
| `adi wegri | 7/2001 | 9/2002 | 60 | |||
| `adi Hare | 7/2001 | 9/2002 | 65 | |||
| meQerka & libon | 4/2001 | 6/2002 | 200 | |||
| af`abet | 6/2001 | 6/2002 | 200 | |||
| `adi gulti | 9/2001 | 5/2003 | 150 | |||
| xeKa iyamo | 9/2001 | 2/2003 | 260 | |||
| ksad`iqa | 10/2001 | 5/2003 | 200 | |||
| weQerti & `adi zamr & zban'angeb | 7/2001 | 5/2002 | 605 | 900 | ||
| Imbaderho | 2/2002 | 12/2002 | 375 | 1757 | ||
| beleza | 2/2002 | 1/2003 | 65 | 188 | ||
| mdrzEn | 12/2002 | 2/2003 | 60 | 134 | ||
| `adi nefas | 7/2001 | 6/2002 | 554 | 2089 | ||
| `adi abeyto | 10/2002 | 1/2003 | 55 | 116 | ||
| `adi segudo | 2/2001 | 2/2001 | 81 | 152 | ||
| bEt gergix | 1/2002 | 12/2002 | 1 | |||
| gezabanda Habexa | 1/2002 | 12/2002 | 1 | |||
| sela`I da`Iro | 1/2002 | 5/2002 | 100 | 156 | ||
| `adi gembelo | 1/2002 | 12/2002 | 170 | 239 | ||
| `adizemat | 10/2002 | 1/2003 | 60 | 105 | ||
| `adi Senaf | 1/2002 | 12/2002 | ||||
| da`Iro Pawlos | 1/2002 | 12/2002 | ||||
| `ameSi | 1/2002 | 12/2002 | 250 | |||
| `adi musa | 1/2002 | 10/2002 | 100 | 105 | ||
| xnjbluQ | 1/2002 | 3/2002 | 100 | 150 | ||
| `adi gebru | 1/2002 | 12/2002 | 88 | |||
| `adi teKlay | 1/2002 | 12/2002 | 92 | |||
| Se`azega (phase 2) | 1/2002 | 12/2002 | 200 | |||
| quxet (phase 2) | 12/2001 | 1/2002 | 150 | 187 | ||
| weki dba (phase 2) | 1/2002 | 12/2002 | 150 | 140 | ||
| `Inagudo | 1/2002 | 12/2002 | 26 | |||
| `adi xmagle (phase 2) | 1/2002 | 12/2002 | 36 | |||
| `adi qexi IDP (phase 1) | 1/2003 | 12/2003 | 2000 | 4826 | ||
| may wuray IDP | 1/2003 | 12/2003 | 300 | |||
| metera IDP | 1/2003 | 12/2003 | 300 | |||
| afame | 1/2003 | 12/2003 | 20 | 180 | ||
| Se`Ida krstyan (phase 2) | 1/2003 | 12/2003 | 100 | |||
| Imbaderho (phase 2) | 1/2003 | 12/2003 | 100 | |||
| ademSemat | 1/2003 | 12/2003 | 70 | |||
| aSenaf | 1/2003 | 12/2003 | 200 | |||
| ma`Ireba | 1/2003 | 12/2003 | 350 | |||
| Hadix `adi | 1/2003 | 12/2003 | 150 | |||
| hazega | 1/2003 | 12/2003 | 35 | 89 | 24 | |
| daro | 1/2003 | 12/2003 | 60 | 45 | 52 | |
| adilgas | 1/2003 | 12/2003 | 420 | 180 | ||
| zegeb | 1/2004 | 12/2004 | 200 | |||
| `adi Hawexa | 1/2004 | 12/2004 | 200 | |||
| `adi ke | 1/2004 | 12/2004 | 90 | |||
| merhano | 1/2004 | 12/2004 | 150 | |||
| `adi riassi | 1/2004 | 12/2004 | 150 | |||
| adem neger | 1/2004 | 12/2004 | 150 | |||
| `adi gWadad | 1/2004 | 12/2004 | 200 | |||
| mealde | 1/2004 | 12/2004 | 221 | |||
| haxuxay | 1/2004 | 12/2004 | 189 | |||
| ederba | 1/2004 | 12/2004 | 219 | |||
| `adi fekay | 1/2004 | 12/2004 | 162 | |||
| hadamu | 1/2004 | 12/2004 | 230 | |||
| sheab | 1/2004 | 12/2004 | 176 | |||
| wasdenba | 1/2004 | 12/2004 | 215 | |||
| shebek | 1/2004 | 12/2004 | 195 | |||
| fekiyabrot | 1/2004 | 12/2004 | 188 | |||
| `adi zemat | 1/2004 | 12/2004 | 196 | |||
| `adi array | 1/2004 | 12/2004 | 187 | |||
| senafe IDP | 1/2004 | 12/2004 | 700 | |||
| `adi qexi IDP (phase 2) | 1/2004 | 12/2004 | 3000 | |||
| koitobie | 1/2004 | 12/2004 | 2000 | |||
| korohom | 1/2004 | 12/2004 | 2000 | |||
| ECD Gash-Barka | 1/2004 | 12/2004 | 100 | |||
| ECD Anseba | 1/2004 | 12/2004 | 310 | |||
| ECD Debub | 1/2004 | 12/2004 | 500 | |||
| ECD South Red Sea | 1/2004 | 12/2004 | 296 | |||
| ECD North Red Sea | 1/2004 | 12/2004 | 478 | |||
| PROGRAM TOTAL | 1/1999 | 12/2004 | 11,049 | 13,396 | 12,731 |
        HOUSEHOLD INTERVIEW FORM FOR
        CARBON CREDIT VERIFICATION
        JANUARY, 2003

Date: ____________________

Interviewer Initials: _______________

Village or location     ___________________

Family name             ___________________

Number of persons in the family:
        number of adult males   _______,
        number of adult females _______,
        number of boys under 16 _______,
        number of girls under 16 _______,


How many people have had a cold or a cough in the last two weeks?
        number of adult males   _______,
        number of adult females _______,
        number of boys under 16 _______,
        number of girls under 16 _______,

Which types of stoves do you use?
        1.  Traditional Mogogo ( )      Improved Mogogo ( )     No Mogogo ( )
        2.  Traditional Mokulo ( )      Improved Mokulo ( )     No Mokulo ( )

        Do you have a second mogogo?  Yes ( )    No ( )

                If yes, what type is the second mogogo?
                        Traditional ( )   Electric ( )   LPG ( )  Improved ( )

1. For cooking taita:

        How many times do you cook taita in a week? ________ times/week

        If you have both traditional and improved mogogo, how often do you use each type?
                                                _________times/week for improved mogogo
                                                _________times/week for traditional mogogo

        How many taita do you cook per session? ________

        Do you cook Kicha when you cook taita? Yes ( )  No ( ) If yes, how many? ______

        How long does it take to cook taita (and Kicha)? ______hrs

        How much of each kind of fuel do you use?
                (if there are both types of mogogo, put amounts for
                traditional mogogo in parentheses)

        ________kg wood, ________kg sticks, ________kg Kindling (gifgaf encheyti),

        ________kg Dung Patties (Kubo), _________kg Loose Dung (gifgaf Kubo)

        ________kg other types: grass( ) sawdust( ) agricultural residue( )

        Do you add kerosene to start the fire? Yes ( )   No ( )

        How much charcoal is left after cooking taita? _________kg dry charcoal


2. For cooking kicha separately from taita:

        How often do you cook kicha separately from taita? ________ times/week

        How many kicha do you cook per session? ____________

        How long does it take to cook kicha? ________hrs

        Do you use the mogogo or the mokulo?  Mogogo ( )      Mokulo ( )

        How much of each kind of fuel do you use?

        ________kg wood, ________kg sticks, ________kg Kindling (gifgaf encheyti),

        ________kg Dung Patties (Kubo), _________kg Loose Dung (gifgaf Kubo)

        ________kg other types: grass ( ) sawdust( ) agricultural residue ( )

        Do you add kerosene to start the fire? Yes ( )   No ( )

        How much charcoal is left after cooking kicha? _________kg dry charcoal

3. Diameter and weight of taita and kicha:

        What is the diameter and weight of taita?

               diameter of taita:________cm,   weight:_________kg

          diameter of mogogo plate:________cm

        What is the diameter and weight of the kicha?

             diameter:________cm,   weight:_________kg

          diameter of mokulo plate:________cm

3. For Improved Stoves (Mogogo and Mokulo)

        Date of construction ________________

        Is the firebox built with stones or ceramic blocks?

                Flat Stones ( )   Ceramic Blocks ( )

        What fills the space inside the stones or blocks?

                Ash ( )   Sand ( )   Air/Nothing ( )    Gravel ( )

        Are the fire grate holes clear and open, or clogged with ash?
                Open/Clear Holes ( )        Clogged with Ash ( )

        Is there a chimney?  Yes ( )    No ( )

        Is there an air control valve for the chimney?  Yes ( )    No ( )

        What are the 3 principal benefits of using the improved stove?

        1) ___________________________________________________________

        2) ___________________________________________________________

        3) ___________________________________________________________

        What are the 3 principal problems of using the improved stove?

        1) ___________________________________________________________

        2) ___________________________________________________________

        3) ___________________________________________________________

        When you move next (change your house or return to your village) will
        you carry the new mogogo parts (grate and chimney) to your new
        house?

        Yes ( ) No ( ) Comment ________________________________________

4. General questions

        Who participates in cooking in your family? ________

        Who buys or collects the fuel for cooking? ________

        Do you collect or buy the fuel for cooking taita?  Collect ( ) Buy ( )

        If you buy, how much do you pay for fuel? _________ Nkfa per ________ (amount)

        If you collect:

           How many times a week do you collect fuel? ________ times/week

           How long does it take you to collect fuel? _______ hrs/round trip


Comment_______________________________________________________________

---
End of interview