By:

Robert Van Buskirk, Ph.D.
Eritrea Technical Exchange Project
3217 College Ave
Berkeley, CA 94705
In this report we provide the CO2 Verified Emissions Reduction (VER's) estimate for the Eritrean Dissemination of Improved Stove Program (EDISP) for 17 villages. The background, purpose and justification for the EDISP project is provided in the project design document. The project design document also provides the description of the CO2 emissions estimation methodology (we reprint an edited version of methodology from the project document in Appendix A).
The amount of VER's of vintage 2002/2003 for the 17 villages is estimated as 4100 tonnes with an average of 2.0 tonnes VER per stove. The VER per stove is lower than the 3 tonnes per stove estimated in the Project Document because the fraction of wood fuel used by households appears to be lower than the fraction of wood fuel estimated at that time.
| Village | Stoves | VER/village (tonnes) | VER/Stove (tonnes) | VER (1999) | VER (2000) | VER (2001) | VER (2002) | VER (2003) |
| damba | 70 | 144 | 2.06 | 0 | 0 | 0 | 144 | 0 |
| zeban'angeb | 142 | 161 | 1.13 | 80 | 0 | 32 | 48 | 0 |
| `adi zamir | 131 | 258 | 1.97 | 0 | 0 | 258 | 0 | 0 |
| `adi sogudo | 81 | 152 | 1.87 | 0 | 0 | 152 | 0 | 0 |
| xnjbluQ | 100 | 150 | 1.50 | 15 | 0 | 0 | 135 | 0 |
| `adi musa | 100 | 105 | 1.05 | 0 | 0 | 11 | 95 | 0 |
| beleza | 65 | 188 | 2.90 | 0 | 0 | 0 | 94 | 94 |
| Imbaderho | 375 | 1757 | 4.69 | 0 | 0 | 0 | 1757 | 0 |
| Se`Ida krstyan | 460 | 505 | 1.10 | 0 | 0 | 354 | 152 | 0 |
| mdrzEn | 60 | 134 | 2.23 | 0 | 0 | 0 | 134 | 0 |
| weki dba | 150 | 140 | 0.94 | 0 | 0 | 0 | 140 | 0 |
| `ademzemat | 60 | 105 | 1.75 | 0 | 0 | 0 | 84 | 21 |
| `adi gembelo | 170 | 239 | 1.41 | 0 | 0 | 0 | 239 | 0 |
| quxet | 150 | 187 | 1.24 | 0 | 0 | 19 | 168 | 0 |
| sela`I da`Iro | 100 | 156 | 1.56 | 0 | 0 | 0 | 156 | 0 |
| `adi abeyto | 55 | 116 | 2.12 | 0 | 0 | 0 | 47 | 70 |
| `adi nefas | 554 | 2089 | 3.77 | 0 | 0 | 1567 | 522 | 0 |
| TOTAL | 2823 | 6587 | 2.33 | 95 | 0 | 2392 | 3915 | 185 |
The VER's are disaggregated by vintage year which is determined by the calendar year in which the improved stove is installed in the village household. The 17 villages were selected out of a total of over 40 villages in the EDISP project based on the criteria of logistical convenience (for data collection) and how recent the stove installations were made. A fairly complete list of EDISP villages is provided in Appendix B.
As can be seen in Table 1, a significant fraction (2487 tonnes) of the VER's in the 17 selected villages have vintages earlier than 2002, while 4100 tonnes of VER's have vintages of 2002/2003. Installation of improved stoves in some villages may occur over the course of many months to a few years. The pace of project implementation depends on the availability of stove parts, and the detailed organizational development of the project at the village level. Therefore the vintage of VER's for any particular village may be spread over one to several years.
Any quantitative estimate of project impacts is subject to potentially substantial uncertainties. Reduction of errors and uncertainties to small levels often requires extensive data collection, research activities that can be quite expensive. Data collection, research and monitoring activities for the EDISP project were constrained to be approximately 20% to 30% of the value of the VER's or approximately $4,000 to $10,000 (the wide range is due to the uncertainty in the volume and price of VER's to be sold).
In order to minimize the uncertainties given limited resources, results from previous research were used for estimating the comparative efficiency of improved vs. traditional stoves and fairly small-sample surveys (10 households per village) were conducted in each village to estimate the average food and fuel consumption for households with improved and unimproved stoves.
The VER estimates are made in a conservative and transparent mannter. The original village interview forms are available for inspection at EDOE's Energy Research and Training Center (ERTC) in Asmara; The transcribed data and VER estimation calculations are provided in a publically available spreadsheet (the spreadsheet, MogogoData20030330.xls, accompanies this report); Photo documentation of the selected verification visits is provided; and any interested party can visit the project villages with a translator and confirm the veracity of monitoring data through independent interviews and surveys.
There are many factors and uncertainties that can affect EDISP project greenhouse gas impacts. Different assumptions, approximations, and unaccounted-for factors may result in more, less, or unknown changes in project VER's. Fundamentally, the certainty of a VER estimate is a matter of judgement and risk evaluation.
Potential factors that may result in a lower VER estimate include:
Factors that may result in a higher VER estimate include:
Factors that may have a significant, but unknown impact on VER estimates:
On balance, given the various factors and their potential impact
on the VER estimate, it is more likely that the VER estimate in this
report is conservative: That is, the CO2
emissions reductions estimate provided in this report has a greater than
50% chance of being lower than the actual CO2
emissions reductions provided by the stove project.
The implementation of the EDISP project is a collaborative activity
of grassroots villages organizations, the local government institutions
at the regional level, and EDOE.
Village-level organizations such as the local women's committee
provide the grassroots organization for community involvement
and the day-to-day implementation of the improved stove project.
The local government administration discusses and communicates the
project possibilities, requirements, and objectives with the local
communities and manages the implementation of individual projects.
It also balances the needs of different villages, setting quotas
that set the amount of material distributed to different villages.
The count of stoves in each village is determined by household
project sign-up lists and the amount of material distributed to
the different villages.
The Department of Energy of the State of Eritrea sets standards
programs and procedures for project implementation and design, provides
technical and design services for the communities and local governments,
distributes non-local project materials and equipment to the local
government administration when needed, and interacts with international
funders and scientists.
Presently, the local government administration reports to the EDOE the
number of stoves installed in each village project. In some villages the
project implementer/organizer may be an NGO or the Ministry of Agriculture
home economics office. To monitor project impacts, EDOE selected villages
from the list of projects provided by the local government administration,
and sent teams of interviewers to the individual villages. Interviewers
contacted local project organizers and conducted 10 household interviews
in each village equiped with scales and measuring tapes to measure
stove dimensions, bread weight, and fuel use. The filled-in interview
forms are then kept on file at the Energy Research and Training Center
where they were later entered into spreadsheets and used for carbon emissions
reduction calculations. The results of the data entry and calculations
are presented in and Excel spreadsheet accompanying this report
Project Implementation and Monitoring
Specific verification activities consisted of reviewing the data from the village interviews, and visiting a subset of the 17 villages to verify the project implementation and to collect baseline energy use data. The villages visited during the course of the verification activities from March 3 to 13, 2003 included:
While in January the town of `adi nefas was visited.
In the village of mdrzEn very little data was collected because the conduct of the interviews was interrupted by a funeral that most households had to attend. While in the town of Se'Ida krstyan it appeard that the vintage of most of the stoves was previous to 2002. Therefore the most intensive verification data collection and interviews were conducted in `adi gembelo, Imbaderho, `adi abeyto, and beleza.
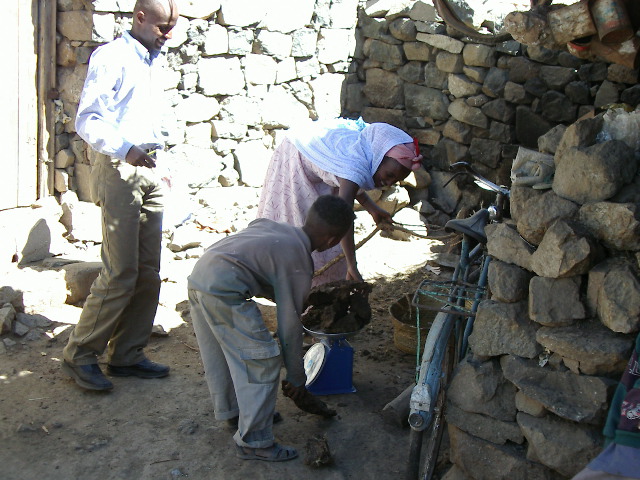
In `adi gembelo the local organizer of the project was visited and a large number of houses with improved stoves could be observed. The team visited a total of 10 households to collect baseline fuel use data by conducting the interviews and weighing examples of fuel that the households provided as shown in the photo below:
At the end of the interviews, the village organizer, megbit, posed with the improved stove that she installed in her house:
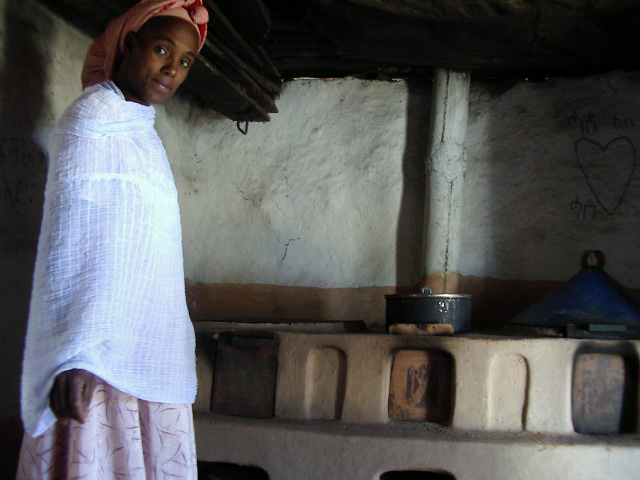
The verfication visit to `adi gembelo was conducted on March 10, 2003.
Two visits were made to the town of Imbaderho, one visit on March 5, 2003 and the other on March 10. On the first visit, a main objective was to independently verify the approximate number of stoves installed in the town of several thousand households. The rough verification was done by randomly selecting four neighborhoods about 5 minutes walk apart and estimating the fraction of households with the improved stoves. Of four randomly selected neighborhoods, one had no improved stoves (because it was an area of small rented store fronts that used primarily electricity), and the other three areas had 12% to 15% of households with improved stoves. This was roughly consistent with local project records that indicated 420 improved stoves and the local government administration report that indicated 375 improved stoves. For VER accounting purposes, the smaller figure was used.
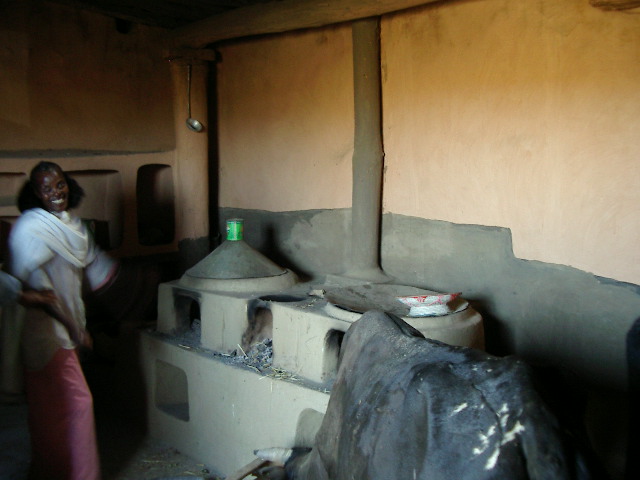
On the second visit, household interviews were conducted regarding baseline energy use, and a picture was taken with the project organizer's stove, complete with in-house dung-fuel source as shown below:
In the visit to `adi abeyto, approximately five households with improved stoves and five households with unimproved stoves were interviewed. One of the households with an improved stove was not able to provide complete data. In the picture below, Debessai Ghebrehiwot from the ERTC can be seen talking with one of the improved stove owners next to the improved stove.

The typical result that the improved stove uses approximately 1/2 of the fuel of the unimproved stove was roughly verified in this village.
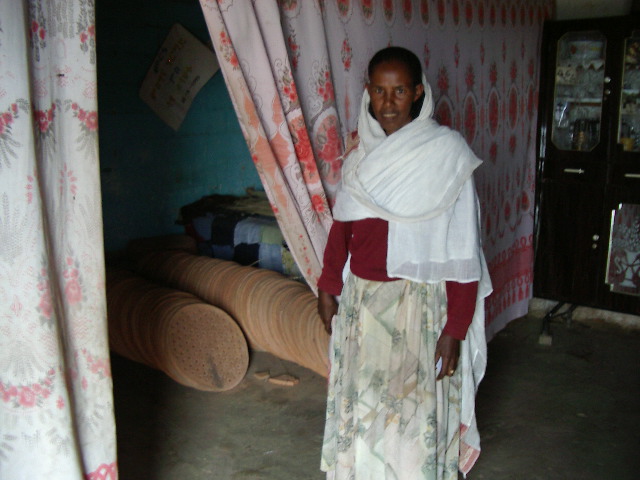
The visit to beleza was conducted on March 5, 2003. The visit focused on investigating the baseline energy use. Interview indicated a more complicated energy use pattern in beleza than other villages with many households burning fairly wet eucalyptus wood to make charcoal for other uses. This made total fuel use in unimproved stoves appear to be more than three times the fuel use of improved stoves. It was also apparent that the initial 65 stoves in beleza was only a beginning with the village organizer preparing to help households install many more stoves over time, as shown in the photo below, where the organizer poses with the ceramic firegrates being stored in her living room:
To simplify the VER calculations for beleza, the baseline energy use for cooking on the unimproved mogogo (without charcoal production) was assumed to be twice the energy use of the improved stoves.
The detailed VER calculations are presented in an Excel spreadsheet (MogogoData20030330.xls). The spreadsheet contains a summary sheet that provides the list of villages and relevant data for each village including the number of stoves, the VER's by vintage, average household sizes, bread cooking/consumption rates, stove types, and fuel use.
The survey data and VER calculations for each village are provided as individual spreadsheets that provide the data, average the survey data values over the interviewed households, and then calculate the CO2 emissions reductions based on the average survey values and the verified assumption that the improved stoves are about twice as efficient as the unimproved stoves. Details of the equations for calculating VER's is provided in appendix A below.
The VER estimation methodology is largely compliant with the methodology laid out in the EDISP project document. Some modifications have been made so that the VER estimate is easier to make given available data and resources. These modifications include:
The basic methodology for estimating CO2 emissions arising from cook-stove use starts with a per-capita emissions estimate. This is because per-capita consumption is likely to be more consistent than per-household consumption due to variations in household size. For the project, emissions are estimated at the village level by first multiplying the per-capita emissions times the average number of people per stove to obtain the per-stove savings and then multiplying the per stove savings to time the number of stoves to obtain the emissions reductions from the stove improvement program in a village.
There is a substantial amount of uncertainty in the estimation of CO2 emissions from cook-stove use. Because of this, the project will use possibly two methods for emissions estimates, based on two independent pieces of data that will be collected from village interviews. The first method estimates emissions from the starting point of per-capita food consumption. Then the factors that convert per-capita food consumption to energy, then to biomass, and then to CO2 emissions. The second method estimates CO2 emissions from the starting point of biomass fuel consumption. The advantage of the first method is that per-capita food consumption can be measured to greater accuracy than per-capita biomass consumption. The advantage of the second method is that fewer conversion factors are needed in order to estimate CO2 emissions from the measured data.
The first method for estimating CO2 emissions is described by the following equation:
where:
In this equation, the injera consumption per capita, InjC, and the fuel fraction, FuelFrac, are estimated from surveys in the project area. The energy intensity of injera production, EInj, is obtained from laboratory experiments and studies, that estimate energy intensity as a function of the final injera thickness or density. The Eritrean Department of Energy may use an average injera energy intensity, if this is not seen to vary substantially between households and villages.
The efficiency of the cook-stove is a function of cook-stove type and features. With regards to firebox construction there are four types of cook-stoves:
In addition, improved stoves may include only the mogogo, or they may include an integrated design of three stoves that includes a mogogo (for cooking taita or injera), a moqolo (for cooking qiCa), and a smaller in-build stove for cooking sauces.
Other features of the stoves may include whether or not the stove has a chimney (almost all improved stoves do), and whether the chimney has a control valve.
The efficiency of the different types of stoves (Eff) are performed using a combination of laboratory and field tests. Average values of efficiency are used that correspond to an average length of cooking session that produces between 15 to 20 injera.
The variables EBio, WetEff, BGBio, and CCont are derived from references in the international literature, as is the value of BLife for wood. An estimate of the value of EBio for dung is provided in an appendix of this report.
The total CO2 emissions are estimated as the sum of the per-capita CO2 emissions for each fuel type times the population.
Table A-1: Emissions Estimation Parameters for Method #1
| Parameter | Low | Medium | High | Selected | Source |
| FracPerm | 80% | 90% | 100% | 90% | Estimated |
| FuelFrac Dung Wood |
100% 0% |
60% 40% |
0% 100% |
60% 40% |
2001 Study |
| InjC | 70 kg/year | 130 kg/year | 180 kg/year | 130 kg/year | 2001 Study |
| EInj | 0.8 MJ/kg | 1.4 MJ/kg | 2.0 MJ/kg | 1.4 MJ/kg | 1996 Study |
| Eff
Old Field Old Lab New A New B New C |
7% 10% 18% 23% 26% |
10% Base 20% Project |
Field Measurement 1998 Study 1998 Measurement Estimated 2000 Measurement |
||
| EBio Dung Wood |
12.0 MJ/kg 16.6 MJ/kg |
12.0 MJ/kg 16.6 MJ/kg |
IPCC 1996 IPCC 1996 |
||
| BLife Dung Wood |
5.0 years |
1.0 years 9.4 years |
13.7 years |
1.0 years 9.4 years |
Estimated IPCC 1996 |
| WetEff | 70% | 90% | 100% | 100% | Estmated |
| BGBio | 0.23 | 0.47 | 0.85 | 0.47 | IPCC 1996 |
| CCont | 1.6 | 1.8 | 2.1 | 1.8 | IPCC 19962 |
The second method for estimating CO2 emissions is described by the following equation:
where:
In this equation, the biomass consumption per capita, Biomass, for a particular fuel type are estimated from surveys in the project area. Ideally such surveys would be conducted both before and after the improved stove project is implemented. If this is not possible then the biomass consumption for one case will be estimated from the biomass consumption from the other case with the following formula:
Biomass1 = Biomass2 * Eff2/Eff1The efficiency of the cook-stove is a function of cook-stove type and stove features as described above in the first emissions estimation method.
The variables WCont, BGBio, and CCont are derived from references in the international literature, as is the value of BLife for wood. An estimate of the value of BLife for dung is provided in an appendix of this report.The total CO2 emissions are estimated as the sum of the per-capita CO2 emissions for each fuel type times the population.
Table A-2: Emissions Estimation Parameters for Method #2| Parameter | Low | Medium | High | Selected | Source |
| FracPerm | 80% | 90% | 100% | 90% | Estimated |
| Biomass Dung Wood |
To Be Measured |
||||
| WCont | 20% | 10% | 0% | 15% | Estimated |
| BLife Dung Wood |
5.0 years |
1.0 years 9.4 years |
13.7 years |
1.0 years 9.4 years |
Estimated IPCC 1996 |
| BGBio | 0.23 | 0.47 | 0.85 | 0.47 | IPCC 1996 |
| CCont | 1.6 | 1.8 | 2.1 | 1.8 | IPCC 1996 |
A preliminary estimate of baseline emissions is provided here using data from the above tables and data received from a recent project test survey `adi nefas. The first estimate is obtained using the first method based on per-capita injera consumption:
This calculation yeilds a baseline estimate of per-capita CO2 emissions from injera cooking as 1199 kg/capita.
Using the second method which is based on surveys of fuel use, we obtain the following estimate of per-capita CO2 emissions:
This calculation using the second method yeilds a baseline estimate of per-capita CO2 emissions from injera cooking as 1370 kg/capita.
The two methods yield quite similar results with the second method providing a slightly higher estimate than the first.
In the VER calculations, it is generally assumed that the unimproved stoves use about twice the amount of fuel as the improved stoves. The per-capita fuel consumption is then multiplied by the average number of people in the household to estimate the per-stove VER's provided in Table 1 of this report. The values of VER per stove vary from about 1 tonnes to over 4 tonnes per stove, largely due to changes in the types of fuel used by households.
A key parameter in the estimate of CO2 emissions impacts from reduced biomass fuel consumption is BLife, the ratio of the annual consumption rate to the biomass stocks. The unit of this parameter is years. In this appendix, we estimate this parameter using data from Volume 3 of the Revised 1996 IPCC Guidelines for National Greenhouse Gas Inventories: the Greenhouse Gas Inventory Reference Manual.
In section 5 of the Greenhouse Gas Inventory Reference Manual on Land-Use Change & Forestry, estimates of annual average aboveground biomass update by natural regeneration are provided in table 5-2. We select for Eritrea, the dry forest regeneration rate for Africa for the first 20 years of regeneration as the figure that is most relevant to Eritrea biomass harvesting. The dry-forest regeneration rate is 4.0 tonnes/ha.
In table 5-4, total aboveground biomass is provided for different forest types for different African countries. We select as most relevant to Eritrea, the dry forest type which is estimated to have average aboveground biomass of 20-55 tonnes/ha. We select the median value of 37.5 tonnes/ha for Eritrea. This provides an estimate for BLife of 37.5/4.0 = 9.4 years.
Below we provide a fairly complete list of all EDISP villages with the approximate actual or planned beginning and endi dates of the project in each village, the number of stoves installed (or planned) and the VER's estimated for the village when available.
Table 2: List of Total EDISP Villages| Village Name | Begin Date | End Date | Stoves Installed | Stoves Planned | VERs | Notes |
| damba (phase 1) | 10/1999 | 12/1999 | 381 | 762 | ||
| damba (phase 2) | 12/2001 | 11/2002 | 70 | 144 | ||
| Se`Ida krstyan | 12/1999 | 12/2002 | 460 | 505 | ||
| `adi gerd | 1/2002 | 6/2001 | 100 | |||
| temajila | 1/2002 | 6/2001 | 100 | |||
| Halibmentel | 1/2002 | 6/2001 | 200 | |||
| `adi qexi barka | 1/2002 | 6/2001 | 60 | |||
| serejeQa kebabi | 1/2002 | 6/2001 | 56 | |||
| weki dba | 1/2002 | 6/2001 | 328 | |||
| tKul | 3/2001 | 4/2003 | 209 | |||
| wuTuH | 1/2001 | 6/2001 | 131 | |||
| maylbus | 4/2001 | 6/2002 | 170 | |||
| `adi tekelEzan | 6/2001 | 12/2002 | 150 | |||
| quxet | 8/2001 | 9/2002 | ||||
| `adi xmagle | 6/2001 | 9/2002 | 30 | |||
| `adi habslus | 6/2001 | 9/2002 | 45 | |||
| Se`azega (phase 1) | 3/2001 | 6/2002 | 200 | |||
| `adi wegri | 7/2001 | 9/2002 | 60 | |||
| `adi Hare | 7/2001 | 9/2002 | 65 | |||
| meQerka & libon | 4/2001 | 6/2002 | 200 | |||
| af`abet | 6/2001 | 6/2002 | 200 | |||
| `adi gulti | 9/2001 | 5/2003 | 150 | |||
| xeKa iyamo | 9/2001 | 2/2003 | 260 | |||
| ksad`iqa | 10/2001 | 5/2003 | 200 | |||
| weQerti & `adi zamr & zban'angeb | 7/2001 | 5/2002 | 605 | 900 | ||
| Imbaderho | 2/2002 | 12/2002 | 375 | 1757 | ||
| beleza | 2/2002 | 1/2003 | 65 | 188 | ||
| mdrzEn | 12/2002 | 2/2003 | 60 | 134 | ||
| `adi nefas | 7/2001 | 6/2002 | 554 | 2089 | ||
| `adi abeyto | 10/2002 | 1/2003 | 55 | 116 | ||
| `adi segudo | 2/2001 | 2/2001 | 81 | 152 | ||
| bEt gergix | 1/2002 | 12/2002 | 1 | |||
| gezabanda Habexa | 1/2002 | 12/2002 | 1 | |||
| sela`I da`Iro | 1/2002 | 5/2002 | 100 | 156 | ||
| `adi gembelo | 1/2002 | 12/2002 | 170 | 239 | ||
| `adizemat | 10/2002 | 1/2003 | 60 | 105 | ||
| `adi Senaf | 1/2002 | 12/2002 | ||||
| da`Iro Pawlos | 1/2002 | 12/2002 | ||||
| `ameSi | 1/2002 | 12/2002 | 250 | |||
| `adi musa | 1/2002 | 10/2002 | 100 | 105 | ||
| xnjbluQ | 1/2002 | 3/2002 | 100 | 150 | ||
| `adi gebru | 1/2002 | 12/2002 | 88 | |||
| `adi teKlay | 1/2002 | 12/2002 | 92 | |||
| Se`azega (phase 2) | 1/2002 | 12/2002 | 200 | |||
| Se`Ida krstyan (phase 2) | 4/2003 | 12/2003 | 220 | |||
| quxet (phase 2) | 12/2001 | 1/2002 | 150 | 187 | ||
| weki dba (phase 2) | 1/2002 | 12/2002 | 150 | 140 | ||
| `Inagudo | 1/2002 | 12/2002 | 26 | |||
| `adi xmagle (phase 2) | 1/2002 | 12/2002 | 36 | |||
| `adi tekelEzan (phase 2) | 3/2003 | 12/2003 | 350 | |||
| `Elaber`Id | 3/2003 | 12/2003 | 350 | |||
| keren | 3/2003 | 12/2003 | 300 | |||
| Hagaz | 3/2003 | 12/2003 | 230 | |||
| HalHal | 3/2003 | 12/2003 | 70 | |||
| Hamelemalo | 3/2003 | 12/2003 | 70 | |||
| geleb | 3/2003 | 12/2003 | 50 | |||
| HaSina | 3/2003 | 12/2003 | 500 | |||
| `adi gulti | 3/2003 | 12/2003 | 450 | |||
| ma`Ireba | 3/2003 | 12/2003 | 450 | |||
| afma | 3/2003 | 12/2003 | 170 | |||
| maqabr Sebla | 3/2003 | 12/2003 | 200 | |||
| `adi xumtenbosa | 3/2003 | 12/2003 | 200 |
How many people reside in the household that uses the mogogo?

____Adult Males ____Adule Females ____Children under 16

How many taita and qiCa are cooked per cooking session and
how often are the cooking sessions?

_____taita ____qiCa every ____ days (or ____ times per week)

How often is qiCa cooked without taita and how often are these
cooking sessions?

____qiCa every ____ days (or ____ times per week)


What is the weight and diameter of the taita that are cooked?
(Here the interviewer asks for a sample of taita, measures the
diameter [perhaps from the plate] and weighs a group of taita)

Diameter = ___cm and ____taita weigh ____ kilograms

Does the household have an improved mogogo? And when was it obtained?

    Improved mogogo? ___ Yes ___No  	Date built:  _____

What type of improved mogogo does the household have?

   Type of Walls: 	___ Rock and Sand
 			___ Ceramic Block and Sand
 			___ Ceramic Block and Ash

   Chimney: 	___ Yes  ___ No	Control Flap: 	___ Yes  ___ No

   Improved moqolo: 	___ Yes  ____ No

How much fuel is used in a cooking session?
(Here the interviewer asks for a sample of the fuel used in one
session and weighs it by fuel type)

Unimproved Mogogo:

___ kg Dung    ___ kg Residue/Kindling    ___ kg Sticks   ___ kg Wood

(Note: sticks are pieces of wood with a diameter less than
2 centimeters, and wood is any wood with a diameter less than this)

Improved Mogogo

___ kg Dung    ___ kg Residue/Kindling    ___ kg Sticks   ___ kg Wood


----------------------
End of interview.